Figures & data
Figure 1 Structural analysis of CNPs.
Notes: (A) Particle size distribution (3–5 nm) of CNPs as determined by TE microscopy. The selected-area electron diffraction pattern (inset) revealed the crystallinity and fluorite structure of CNPs. (B) X-ray diffraction pattern of CNPs; 111, 200, 220, and 311 correspond to the different lattice planes of the CNP crystal structure.
Abbreviations: CNP, ceria nanoparticle; TE, transmission electron.
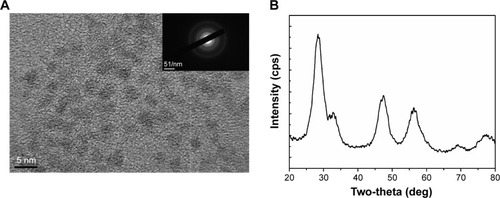
Figure 2 NGA-CNP synthesis.
Notes: (A) Structure of NGA. (B) Steps in the synthesis of NGA-CNPs.
Abbreviations: NGA-CNP, ceria nanoparticle modified with neogambogic acid; NGA, neogambogic acid; CNP, ceria nanoparticle; BOP, benzotriazol-1-yloxytris-(dimethyl amino) phosphonium hexafluorophosphate; NMM, N-methyl morpholine; DMF, dimethyl formamide.
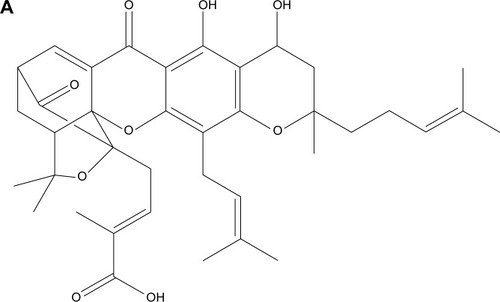
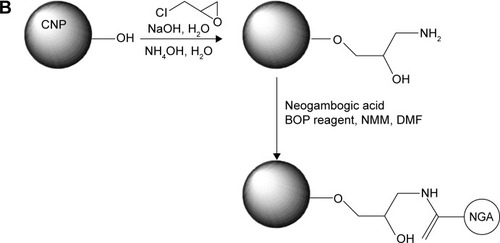
Figure 3 FTIR and XPS analysis of NGA-CNPs.
Notes: (A) FTIR spectrum of CNPs before and after modification with epichlorohydrin. Absorption at 1,100 cm−1 and 1,650 cm−1 corresponding to hydroxide and amine groups, respectively, was observed for amine-functionalized CNPs (NH2-CNP; red line) relative to unmodified CNPs (black line). (B) XPS spectrum of functionalized CNPs. Numbers represent positions of peaks.
Abbreviations: FTIR, Fourier transform infrared spectroscopy; XPS, X-ray photoelectron spectroscopy; NGA-CNP, ceria nanoparticle modified with neogambogic acid; CNP, ceria nanoparticle; au, arbitrary unit.
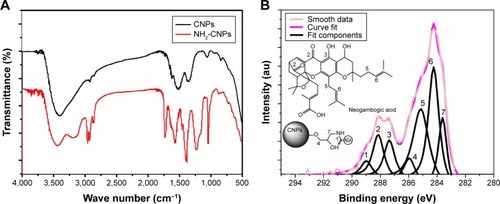
Figure 4 Enhancement of radiation-induced growth inhibition by NGA, CNP, and NGA-CNPs.
Notes: The surviving fraction of MCF-7 cells was decreased by RT in a dose-dependent manner, an effect that was potentiated by the addition of NGA-CNPs. (C), compared with NGA (A), or CNPs (B).
Abbreviations: NGA, neogambogic acid; CNP, ceria nanoparticle; NGA-CNP, ceria nanoparticle modified with neogambogic acid; RT, irradiation.
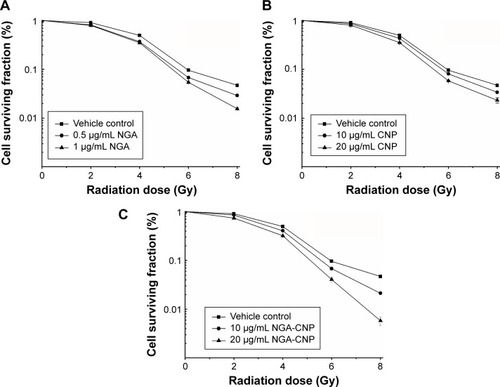
Figure 5 Enhancement of radiation-induced apoptosis by NGA, CNPs, and NGA-CNPs.
Notes: (A) MCF-7 cells were exposed to indicated concentrations of NGA/CNPs/NGA-CNPs or 6 Gy radiation or both, and stained with annexin V–FITC/PI before flow cytometry analysis. In each plot, the lower left corner shows annexin V-/PI-negative cells (living cells); the lower right corner shows annexin V-positive cells (apoptotic cells); the top right corner shows PI-positive cells (dead cells with membranes permeable to PI) stained with annexin V; and the top left corner shows dissociated nuclei. (B) Quantitative analysis of dead vs living cells. Data were analyzed by analysis of ANOVA followed by the Bonferroni post hoc test. **P<0.01, and ***P<0.0001, the groups compared with vehicle control group; ##P<0.01 and ###P<0.001, the NGA-CNP group compared with NGA group; ^^^P<0.001, the NGA-CNP group compared with CNP group.
Abbreviations: NGA, neogambogic acid; CNP, ceria nanoparticle; NGA-CNP, ceria nanoparticle modified with neogambogic acid; FITC, fluorescein isothiocyanate; PI, propidium iodide; ANOVA, analysis of variance.
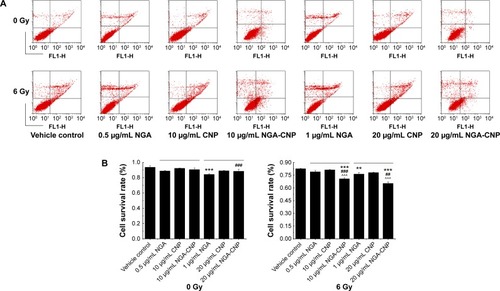
Figure 6 Effect of NGA-CNPs on MCF-7 cell cycle distribution.
Notes: (A) Cells were pretreated with the vehicle DMSO or NGA-CNPs for 24 hours before exposure to 0 Gy or 6 Gy radiation, and the fraction of cells in each phase of the cell cycle was analyzed by flow cytometry. (B) Quantitative analysis of cell cycle distribution.
Abbreviations: NGA-CNP, ceria nanoparticle modified with neogambogic acid; DMSO, dimethyl sulfoxide; G2, second gap phase; M, mitosis phase; S, synthesis phase; G0, zero gap phase; G1, first gap phase.

Figure 7 Autophagy in MCF-7 cells treated with NGA-CNPs and radiation.
Notes: (A) Cells were incubated with indicated concentrations of NGA-CNPs for 24 hours followed by exposure to indicated doses of radiation; 24 hours later, cells were stained Cyto-ID (green) for detection of autophagic vacuoles and counterstained with Hoechst 33342 to label nuclei. (B) Quantitative analysis of autophagic cells (ie, with at least three green dots or a green cluster). Data were analyzed by analysis of ANOVA followed by Bonferroni post hoc test. ***P<0.0001, the groups compared with vehicle control groups (0 μg/mL +0 Gy group, or 0 μg/mL +6 Gy group).
Abbreviations: NGA-CNP, ceria nanoparticle modified with neogambogic acid; ANOVA, analysis of variance.
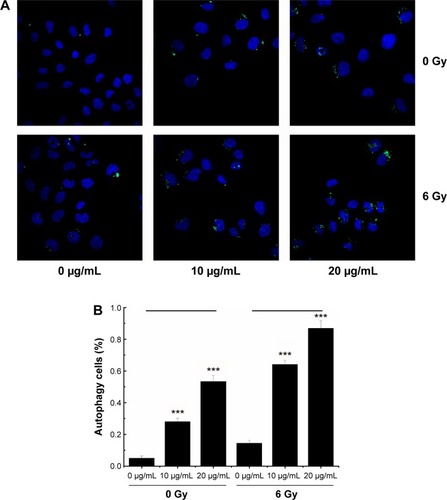
Figure 8 Detection of autophagy in MCF-7 cells by flow cytometry.
Notes: Cells were treated with indicated concentrations of NGA-CNPs without (A) or with (B) subsequent radiation treatment. A 488 nm laser source and the FL1 channel were used to detect the green fluorescence of autophagic cells.
Abbreviation: NGA-CNP, ceria nanoparticle modified with neogambogic acid.
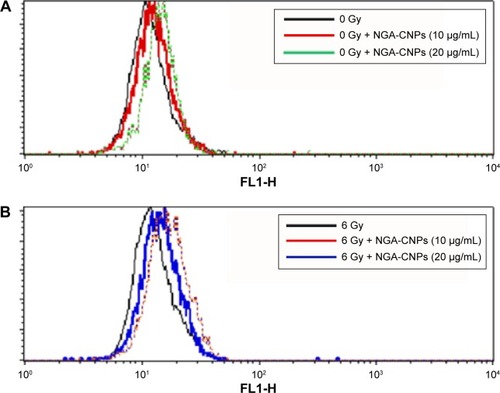
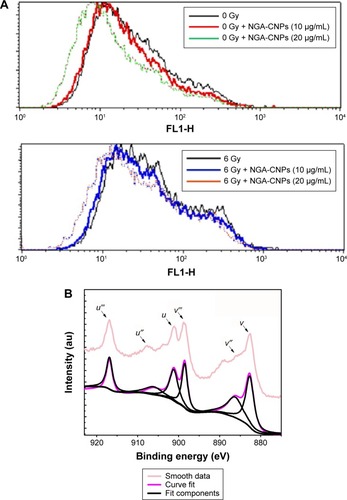
Figure 9 Detection of ROS in MCF-7 cells by flow cytometry.
Notes: (A) Suppression of ROS generation in MCF-7 cells by NGA-CNPs. Cells were treated with indicated concentrations of NGA-CNPs without (top) or with (bottom) subsequent radiation treatment. A fluorometric assay based on the oxidation of DCFH-DA by intracellular oxidants was used in conjunction with flow cytometry to detect ROS. (B) Ce 3d3/2, 5/2 XPS spectrum for NGA-CNPs.
Abbreviations: ROS, reactive oxygen species; NGA-CNP, ceria nanoparticle modified with neogambogic acid; DCFH-DA, 2′,7′-dichlorofluorescin diacetate; XPS, X-ray photoelectron spectroscopy.