Figures & data
Table 1 The different chemicals and their amounts that were used in the syntheses
Figure 1 SEM micrographs of mesoporous titania thin films.
Notes: SEM micrographs of mesoporous titania thin films prepared with the following structure-directing agents: (A) CTAB, (B) BRIJ S10, (C) P123, (D) P123 and PPG as swelling agents with a ratio of 1:0.5 (PPG-0.5), and (E) P123 and PPG as a swelling agent with a ratio of 1:1 (PPG-1).
Abbreviations: CTAB, cetyltrimethylammonium bromide; PPG, poly(propylene glycol); SEM, scanning electron microscopy.
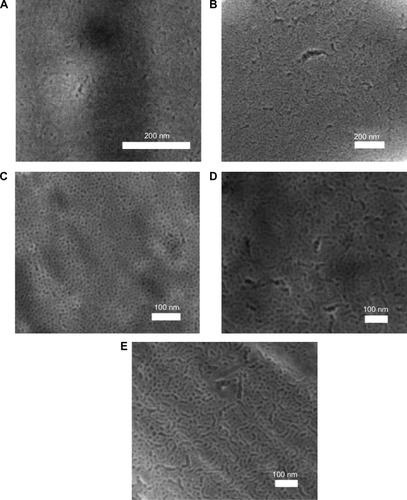
Figure 2 TEM micrographs of the different prepared mesoporous titania films.
Notes: TEM micrographs of the different prepared mesoporous titania films using the following templates: (A) CTAB, (B) BRIJ S10, (C) P123, (D) P123:PPG with a ratio of 1:0.5 (PPG-0.5), and (E) P123:PPG with a ratio of 1:1 (PPG-1).
Abbreviations: CTAB, cetyltrimethylammonium bromide; PPG, poly(propylene glycol); TEM, transmission electron microscopy.
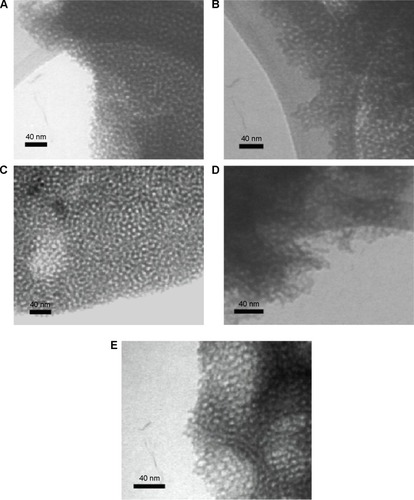
Table 2 The average pore sizes measured in SEM and TEM images of the different samples
Figure 3 SEM images of mesoporous titania film cross-sections coated on glass slides.
Notes: Cross-sections of (A) a BRIJ S10 coating and (B) a PPG-0.5 coating are shown.
Abbreviations: PPG, poly(propylene glycol); SEM, scanning electron microscopy.
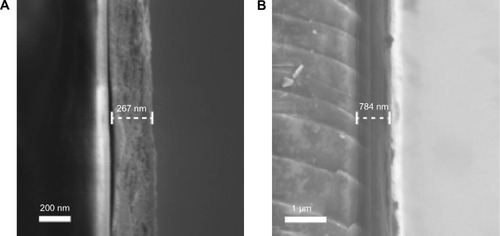
Figure 4 SAXS data for the mesoporous titania films possessing different pore sizes and the nonporous titania.
Notes: The peak positions are marked with *. The curves representing the different samples are separated in y-direction to simplify the visual comparison between them.
Abbreviation: SAXS, small angle X-ray scattering.
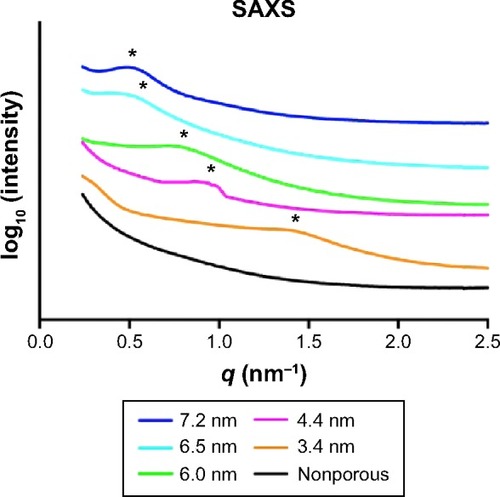
Table 3 XPS data presented as relative atomic% for the mesoporous titania thin films possessing different pore sizes
Table 4 Contact angle for unmodified and surface-functionalized coatings
Table 5 Pore volume of the mesoporous titania thin films obtained from QCM-D experiments utilizing the density difference between H2O and D2O
Figure 5 QCM-D results of the adsorption and release of ALN.
Notes: The adsorption proceeded until the time point marked with *; thereafter, the surfaces were rinsed with pure water to examine the release rate of ALN. The results are shown for both the unmodified mesoporous titania (A) and for the dimethylsilane treated materials (B) as the mass ALN per coating area (ca). In (C) and (D), the data are recalculated as mass per internal area (ia) for the unmodified and modified coatings, respectively.
Abbreviations: ALN, alendronate; QCM-D, quartz crystal microbalance with dissipation.
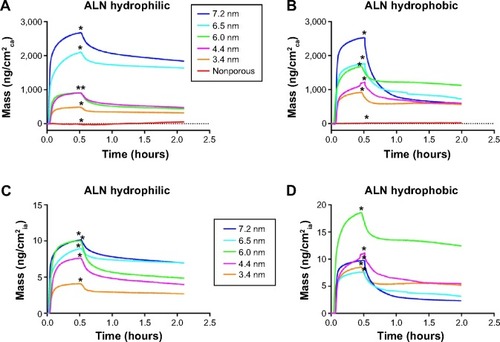
Table 6 The calculated adsorption rate constant, ka, for both the unmodified and silane-modified samples in respect to their internal area (cm2)
Figure 6 QCM-D data for the 7.2 nm sample, displaying the different stages of ALN adsorption and release.
Notes: In (1), the adsorption kinetics is the rate-limiting factor. In (2), the rate-limiting factor of the adsorption is the diffusion factor. Between (2) and (3), the flow is changed to the rinsing flow, and the initial release (3) is determined by the molecular diffusion. The release becomes thereafter sustained (4) and the rate-limiting step is then the desorption isotherm.
Abbreviations: ALN, alendronate; QCM-D, quartz crystal microbalance with dissipation.
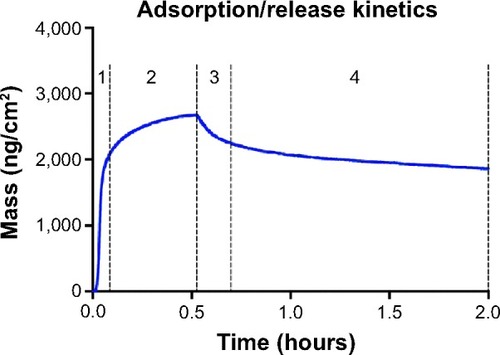
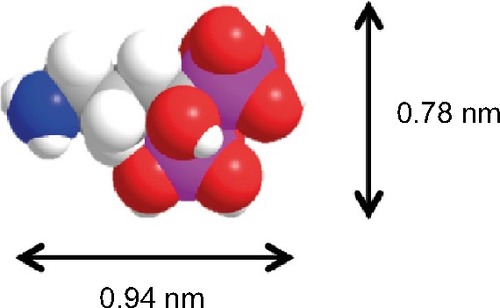
Figure 7 The molecular structure and size of the osteoporosis drug alendronate (ALN).