Figures & data
Figure 1 A) AFM topographic images showing individual C-Co NPs. B) Low and C, D, E) high magnification TEM images of graphitic C) C-Co, D) C-Fe and E) C-Fe/Co NPs obtained by RF-cCVD method.
Abbreviations:
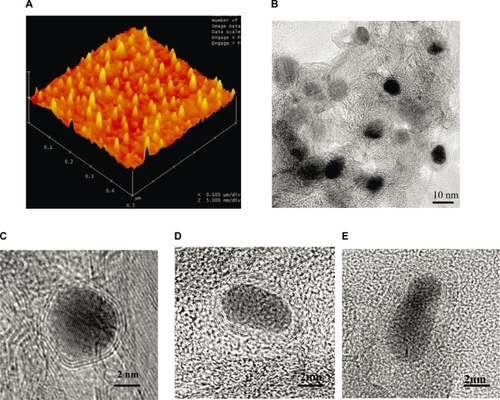
Figure 2 XPS spectra of the Co2p and Fe2p peaks represent the patterns of C-Fe and C-Co magnetic NPs.
Abbreviations:
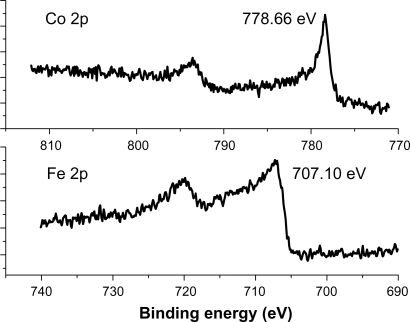
Figure 3 A) Cytotoxicity effects of the low concentration (0.83 μg/mL) C-Co, C-Fe/Co, and C-Fe NPs on the HeLa cancer cells after 2 to 30 minutes of RF exposure. B) Effect of different concentrations of the C-Fe, C-Fe/Co, and C-Co NPs on the HeLa cells that died from 350 kHz RF heating after two minutes of exposure time. C) Comparative RF-induced temperature variations as the function of different C-Fe, C-Fe/Co, and C-Co NP concentrations. Insert figure shows the temperature-rising characteristics of different magnetic NPs with the same amount under 350 kHz RF exposure.
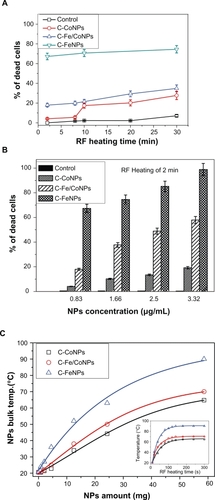
Figure 4 A) Normal HeLa cells without incubation of magnetic NPs; B) After 24 hours incubation time, the magnetic C-Co NPs were found to aggregate around and further penetrate into the nucleus of HeLa cells. C) The images took from the Olympus confocal microscopy indicating the membrane blebbing of HeLa cells incubated with magnetic C-Fe NPs after 350 kHz RF heating for two minutes. Confocal microscopy images indicating the extensive live and dead cells after being incubated with the C-Co NPs D) C-Fe/Co NPs E), and C-Fe NPs F) after exposure to RF radiation for two minutes. The cells were stained in order to distinguish between the live (green for acridine orange) and the dead cells (orange for ethidium bromide).
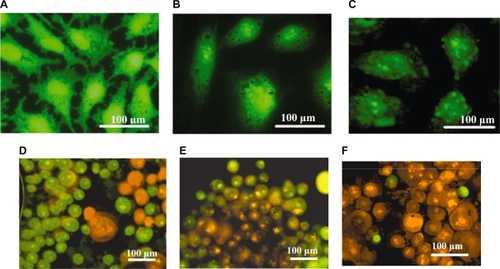
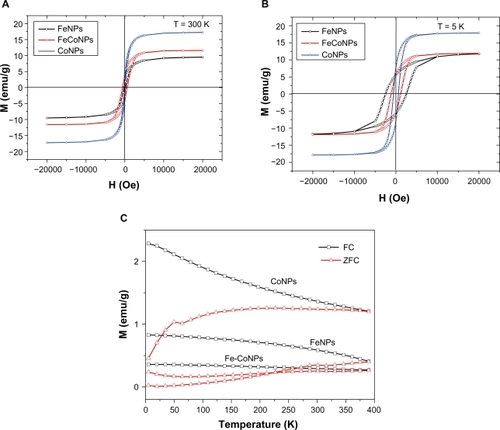
Figure 5 Magnetization curves of different magnetic NPs at 300 K A) and 5 K B); C) Temperature dependence of ZFC and FC measurements recorded at a magnetic field of 30 Oe for these magnetic NPs.
Abbreviations: