Figures & data
Table 1 Formulation details and properties of CyA-loaded cubic nanoparticles
Figure 1 Cryo-TEM photographs of blank A) and CyA-loaded B) cubic nanoparticles. The bars equal 200 nm.
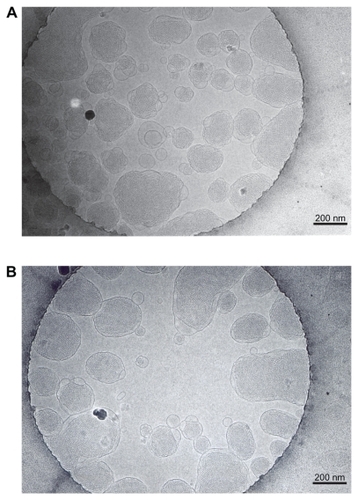
Figure 2 Size distribution of CyA-loaded cubic nanoparticles after sonication A) and homogenization at 689 bar for five cycles B).
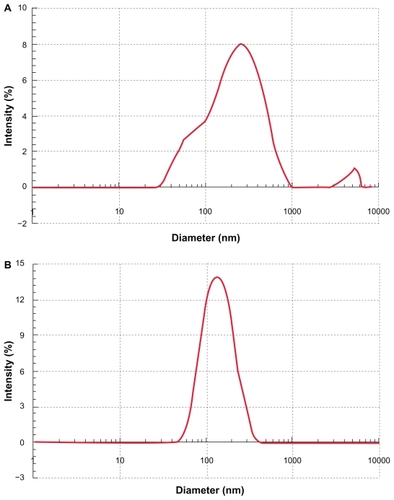
Figure 3 Effect of GMO/poloxamer 407 ratio A) and homogenization pressure and cycles B) on mean diameter of CyA-loaded cubic nanoparticles (n = 3).
Note: *P < 0.01 compared to any other group.
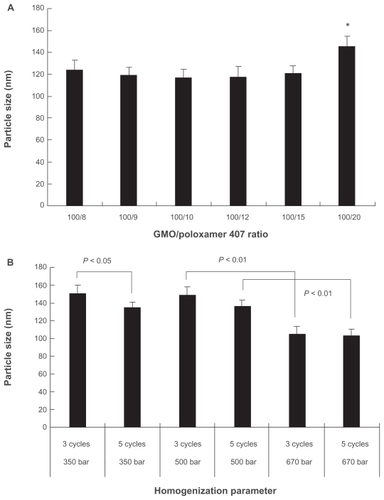
Figure 4 Effect of GMO/poloxamer 407 ratios A) and homogenization pressure and cycles B) on entrapment efficiency of CyA-loaded cubic nanoparticles (n = 3).
Notes: *P < 0.05 as compared to any other group; **P < 0.05 as compared to any other group except these two groups.
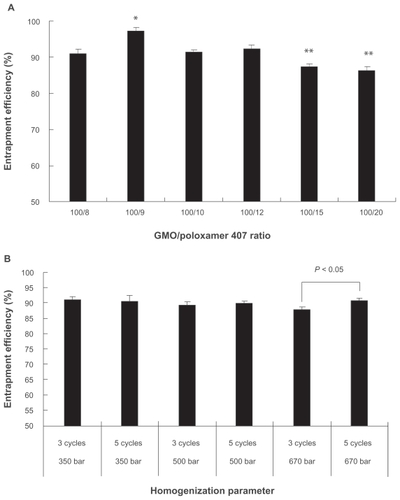
Figure 5 Release profiles of CyA-loaded GMO/poloxamer 407 cubic nanoparticles and Neoral® capsules (n = 3).
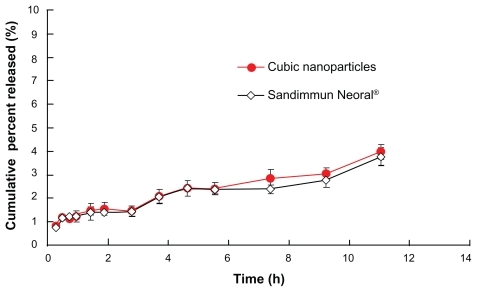
Figure 6 Beagle dog plasma CyA concentrations versus time plot after a single oral dose of 100 mg equivalent CyA cubic nanoparticles or Sandimmun Neoral® (n = 6).
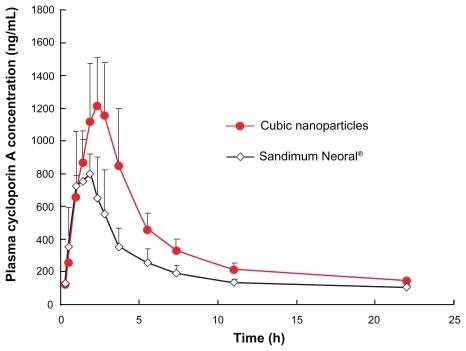
Table 2 Pharmacokinetic parameters after oral administration of CyA-loaded cubic nanoparticles and Sandimmun Neoral® calculated by a noncompartmental method
Table 3 Pharmacokinetic parameters after oral administration of CyA-loaded cubic nanoparticles and Sandimmun Neoral® calculated by a two-compartmental method