Figures & data
Table 1 Compositions, % transmittance, globule size, emulsification times, and solubility of the investigated SNEF
Figure 1 Ternary phase diagram of butyl lactate/Capryol®/Solubilisant Gamma® and Transcutol®.
Abbreviations: BL, butyl lactate; CP, Capryol® 90.
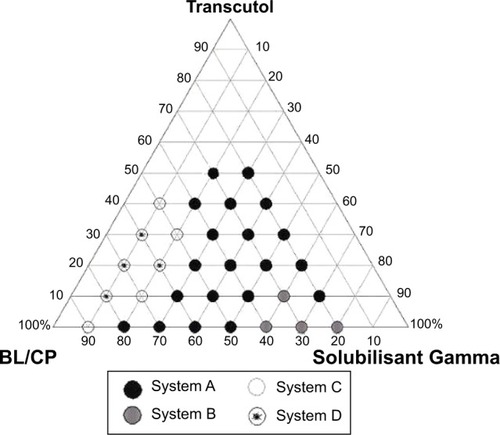
Figure 2 Solubility of CZL in various oils, surfactants and co-surfactants.
Abbreviations: CZL, cilostazol; SG, Solubilisant Gamma® 2429.
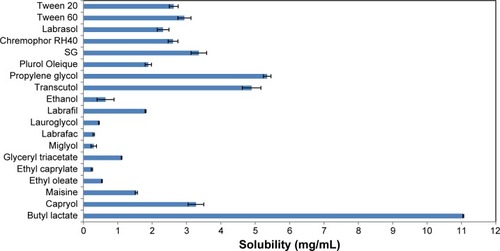
Table 2 Emulsification efficiency of various surfactants
Table 3 Emulsification efficiency of surfactant/co-surfactant combinations
Figure 3 Correlation between globule size analysis and % transmittance of diluted PCs.
Abbreviation: PCs, preconcentrates.
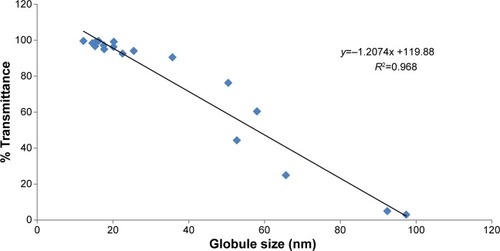
Table 4 Regression results and statistical analysis of measured responses
Figure 4 Response surface plots for (A) solubility; (B) globule size; (C) % transmittance; (D) emulsification time; (E) % of unprecipitated drug; (F) % released after 1 minute as a function of % oil and S/Co-s ratio.
Abbreviations: S/Co-s, ratio of surfactant to co-surfactant.
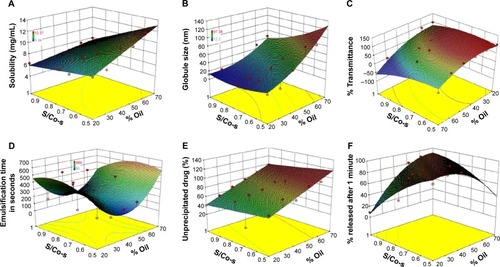
Figure 5 3D response surface plot for the effect of the three formulation components on percentage of CZL precipitated.
Abbreviations: CZL, cilostazol; ppt, precipitate; SG, Solubilisant Gamma® 2429; 3D, three-dimensional; Trans, transcutol.
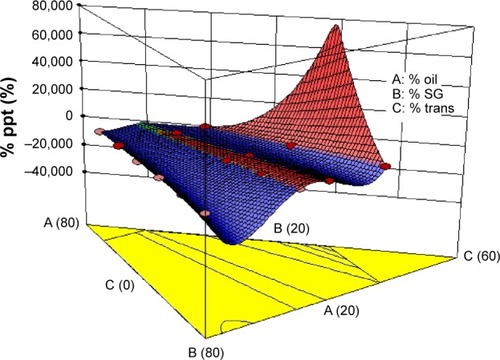
Figure 6 In vitro dissolution of CZL from investigated PCs and pure CZL in phosphate buffer pH 6.8 at 37°C.
Abbreviations: CZL, cilostazol; PCs, preconcentrates.
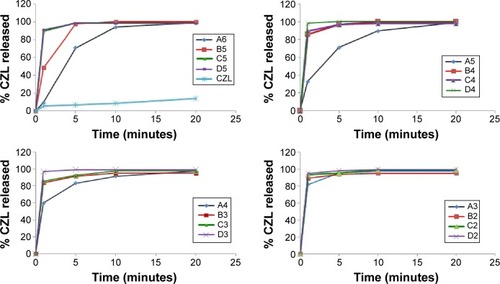
Figure 7 Response surface plot for the overall desirability (D) as a function of oil percentage and S/Co-s ratio.
Abbreviation: S/Co-s, ratio of surfactant to co-surfactant.
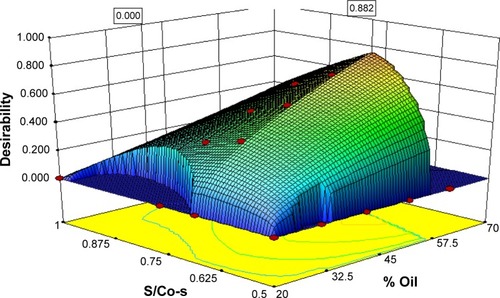
Table 5 Predicted and observed responses of optimized CZL preconcentrates
Figure 8 TEM micrographs of (A) diluted NE preconcentrates and (B) reconstituted SNEGs (×50,000).
Abbreviations: PC, preconcentrate; S/Co-s, ratio of surfactant to co-surfactant; SNEGs, self-nanoemulsifying granules; TEM, transmission electron microscopy; NE, Nanoemulsion.
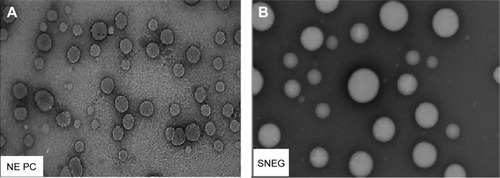
Figure 9 Scanning electron micrographs of (A) Aerosil® 200 and (B) SNEGs.
Abbreviation: SNEGs, self-nanoemulsifying granules.
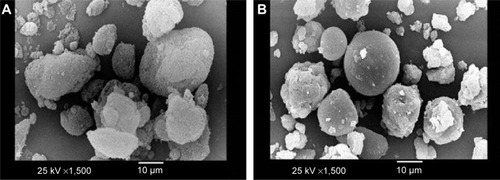
Figure 10 In vitro release profile of CZL from SNEGs, conventional tablet, and drug powder.
Abbreviations: CZL, cilostazol; SNEGs, self-nanoemulsifying granules.
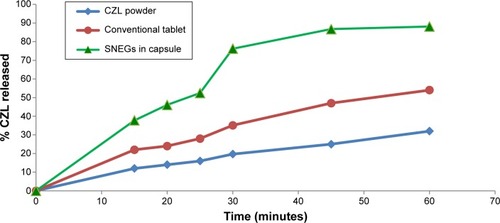
Figure 11 Cumulative percentage of CZL permeated from SNEGs and conventional tablet suspension through non-everted rat intestine at 37°C.
Abbreviations: CZL, cilostazol; SNEGs, self-nanoemulsifying granules.
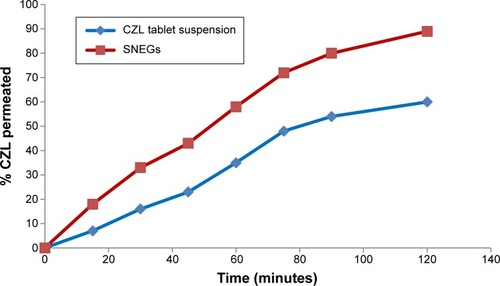
Figure 12 Log percentage drug remaining versus time plot of CZL-loaded SNEGs.
Abbreviations: CZL, cilostazol; SNEGs, self-nanoemulsifying granules.
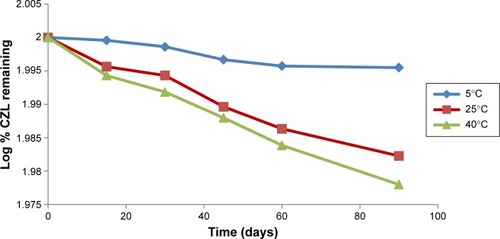
Figure 13 Arrhenius plot for CZL–SNEGs.
Abbreviations: CZL, cilostazol; SNEGs, self-nanoemulsifying granules.
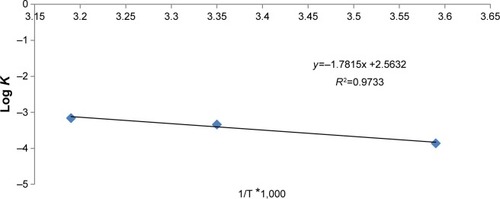
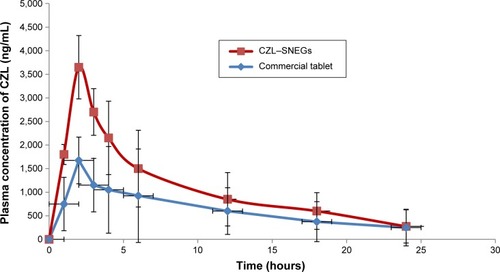
Figure 14 Comparative plasma concentration–time profile of CZL after oral administration of SNEGs and commercial tablets to rabbits.
Abbreviations: CZL, cilostazol; SNEGs, self-nanoemulsifying granules.