Figures & data
Scheme 1 Hybridization of nanoparticles and macrophage through cell surface modification. Sialic acid residues on the cell surface are modified with sodium periodate to generate aldehydes. Aldehydes react with amine group of PEG conjugated to the nanoparticle surface to form Schiff bases. Schiff bases can be further reduced to stable secondary amine linkages using sodium cyanoborohydride.
Abbreviation: PEG, polyethylene glycol.
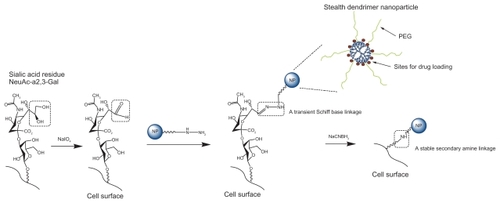
Figure 1 Fluorescence emission spectra of AAF and AAF-G4.5-PEG.
Abbreviation: PEG, polyethylene glycol.
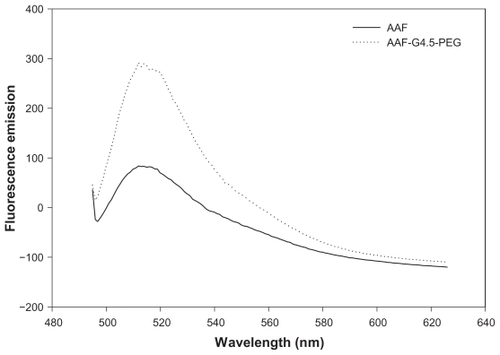
Figure 2 pH-dependent viability of RAW264.7 macrophages. Cells were incubated for two hours at the indicated pH, and then assessed by the Trypan blue assay 48 hours later. Nontoxicity of 0.1 mM sodium cyanoborohydride in DMEM at pH 7.4 was confirmed.
Note: Bar = SD.
Abbreviations: DMEM, Dulbecco’s modified Eagle’s medium; SD, standard deviation.
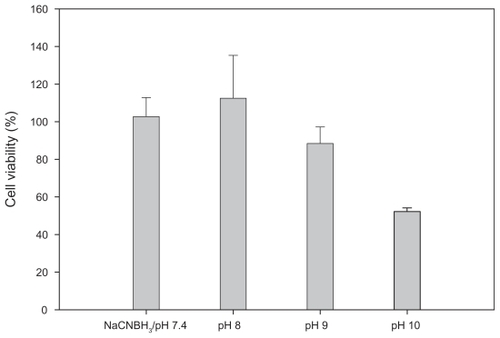
Figure 3 Fluorescence microscopy images of macrophage–Qdot hybrids. A) Macrophage–T-Qdot: macrophages treated with sodium periodate, incubated with QD525 for four hours, and fixed; B) Macrophage–S-Qdot: macrophages treated with sodium periodate, incubated with QD525 for four hours, treated with sodium cyanoborohydride, and fixed.
Notes: Original magnification, ×400; scale bar, 10 μm.
Abbreviation: Qdot, quantum dot.
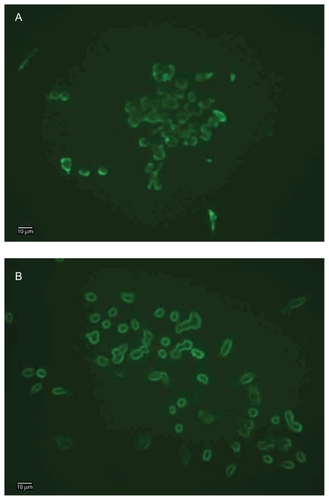
Figure 4 Confocal microscopy images of macrophage–Qdot hybrids at four hours (left panel) or 14 hours (right panel) post-treatment. A) QD525 incubated with untreated macrophages (control); B) Macrophage–T-Qdot hybrids; C) Macrophage–S-Qdot hybrids.
Notes: Original magnification, ×630.
Abbreviation: Qdot, quantum dot.
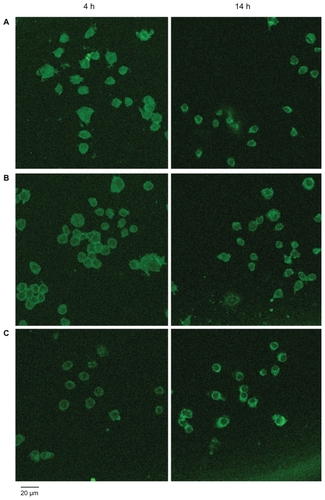
Figure 5 Confocal microscopy images of macrophage–dendrimer hybrids. A) Untreated macrophages incubated with AAF-G4.5-PEG for 10 minutes and fixed immediately (control); B) Macrophage–T-dendrimer hybrids fixed immediately following 10-minute incubation with AAF-G4.5-PEG; C) Macrophage–S-dendrimer hybrids fixed at 14 hours following treatment of sodium cyanoborohydride. Original magnification, ×630.
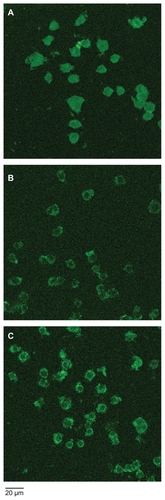
Figure 6 Colocalization assay of AAF-G4.5-PEG (green) with nuclei (blue) by confocal microscopy. A) Control 1: untreated macrophages incubated with AAF-G4.5-PEG for one minute, washed and cultured overnight (24 hours), then fixed and counterstained with DAPI; B) Control 2: untreated macrophages incubated with AAF-G4.5-PEG overnight (24 hours), then fixed and counterstained with DAPI; C) Macrophage–T-dendrimer hybrids: sodium periodate-treated macrophages incubated with AAF-G4.5-PEG for one minute, cultured overnight (24 hours), then fixed and counterstained with DAPI; D) Macrophage–S-dendrimer hybrids: sodium periodate-treated macrophages incubated with AAF-G4.5-PEG for one minute, treated with sodium cyanoborohydride, cultured overnight (24 hours), then fixed and counterstained with DAPI.
Notes: Original magnification, ×630.
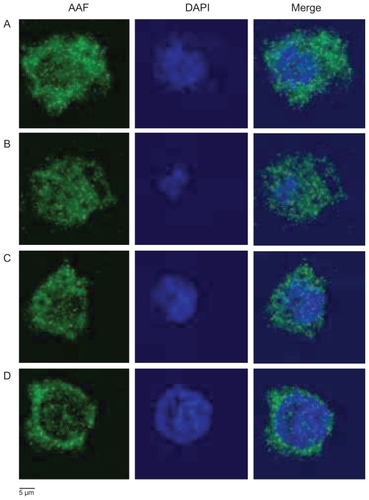
Figure 7 Quantitative analysis of the distribution of fluorescence intensity in representative cells. A) Control 1; B) Control 2; C) Macrophage–T-dendrimer hybrid; D) Macrophage–S-dendrimer hybrid. The treatment conditions are detailed in .
Notes: Original magnification, ×630.
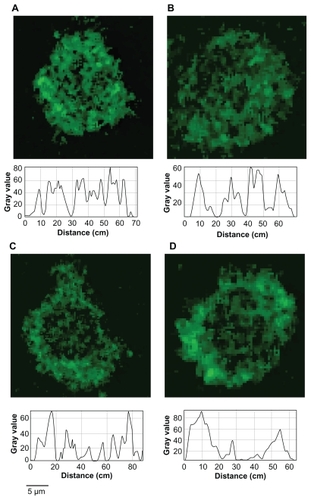
Table 1 Summary of the distribution of AAF fluorescence intensity in macrophages subjected to various treatments as indicated below