Figures & data
Figure 1 Chemical structures of (A) artesunate and (B) febrifugine.
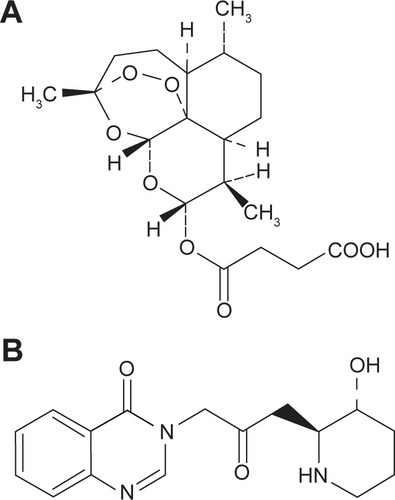
Table 1 Result of antimalarial experiments (n=10)
Table 2 Effects of phospholipid on particle size of ethosomes (mean ± standard deviation, n=3)
Table 3 Effects of surfactants on particle size of ethosomes (mean ± standard deviation, n=3)
Figure 2 The effect of quantity of phospholipid (S100) on ethosomes (n=3).
Abbreviation: EE, entrapment efficiency.
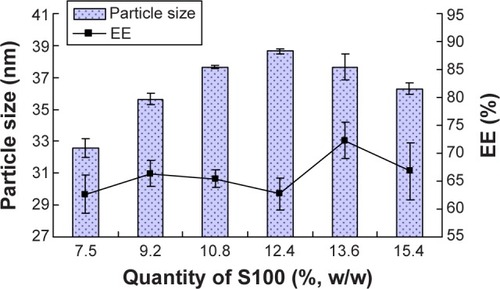
Figure 3 The effect of quantity of Tween 80 on ethosomes (n=3).
Abbreviation: EE, entrapment efficiency.
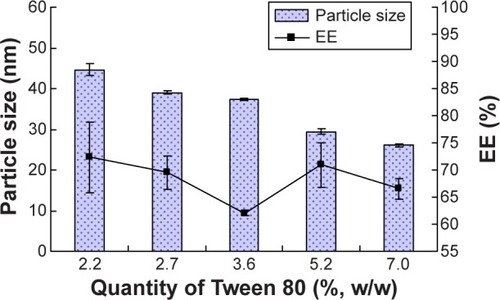
Figure 4 The effect of quantity of cholesterol on ethosomes (n=3).
Abbreviation: EE, entrapment efficiency.
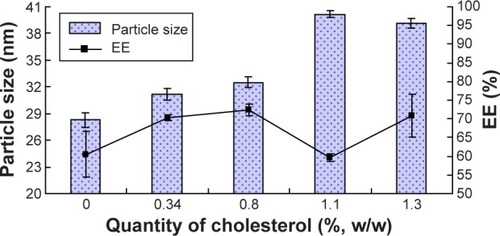
Table 4 Factors and levels of the L9(3Citation4) orthogonal design (n=3)
Table 5 Comprehensive indicators of entrapment efficiency and particle size
Table 6 Transdermal permeation parameters of different antimalarial formulations (n=6)
Figure 5 The effect of dosage of artesunate on ethosomes (n=3).
Abbreviation: EE, entrapment efficiency.
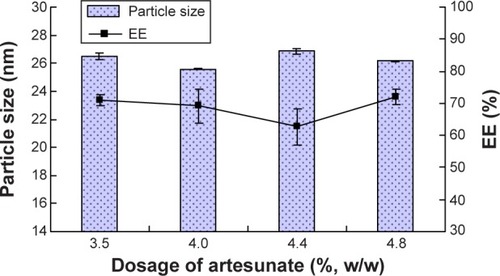
Figure 6 Appearance of ethosomes.
Notes: (A) Artesunate-loaded ethosomes. (B) Febrifugine-loaded ethosomes.
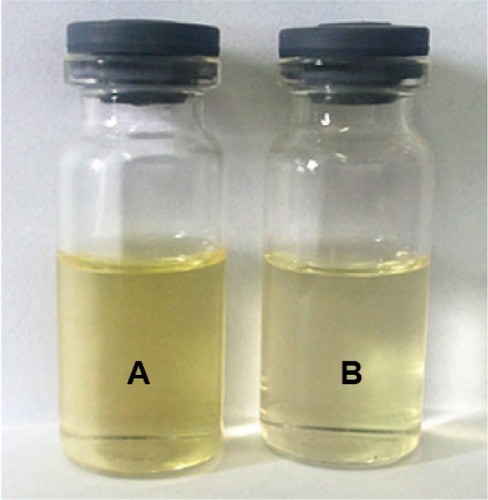
Figure 7 Transmission electron microscope images of the artesunate-loaded ethosomes.
Notes: (A) The overview of the morphology of artesunate-loaded ethosomes; (B) the specific morphology of artesunate-loaded ethosomes; (C) the image of nanoparticles contacting each other.
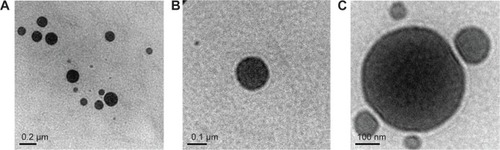
Figure 8 Transmission electron microscope images of the febrifugine-loaded ethosomes.
Notes: (A) The overview of the morphology of febrifugine-loaded ethosomes; (B) the specific morphology of febrifugine-loaded ethosomes.
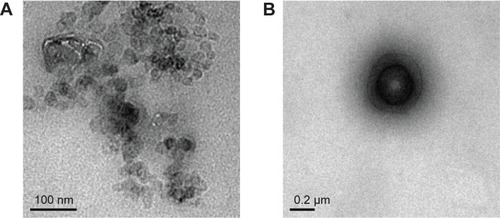
Figure 9 Stability of (A) artesunate-loaded and (B) febrifugine-loaded ethosomes stored at 4°C for 90 days.
Abbreviation: PDI, polydispersity index.
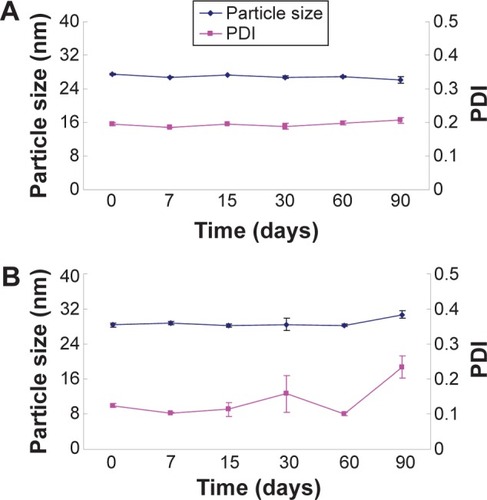
Table 7 Release model parameters of different antimalarial formulations (n=6)
Figure 10 Influence of ethosomes on the release of (A) artesunate and (B) febrifugine from cataplasm (n=6).
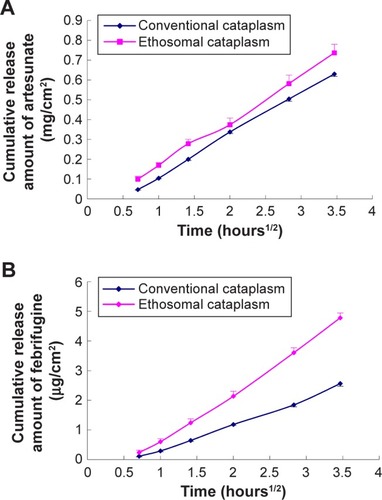
Figure 11 Influence of ethosomes on the penetration of (A) artesunate and (B) febrifugine from cataplasm (n=6).
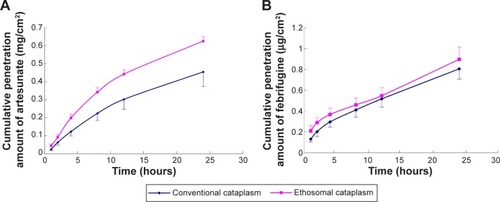
Figure 12 The optical microscope pictures of thin blood smears.
Notes: Blank ethosomal cataplasm, blank control group and treatment groups (A–J) are shown. (A–E) Treated with conventional cataplasm; (F–J) treated with ethosomal cataplasm; specific administration dosages showed in .
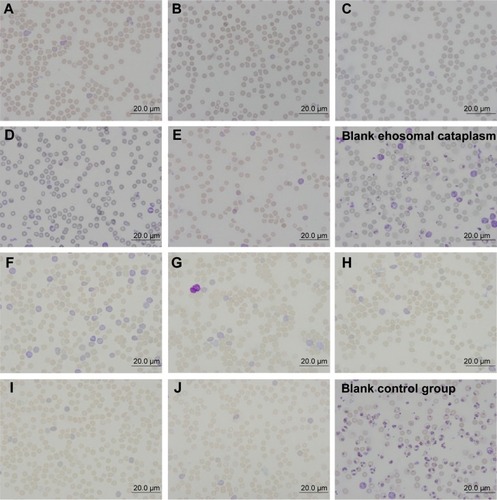
Figure 13 Ordinary optic microscopic pictures of skins.
Notes: Microphotographs (100×) of vertical section of skin: (A) untreated skin; (B) skin treated with ethosomal cataplasm; (C) skin treated with conventional cataplasm. Microphotographs (400×) of skin: (D) untreated skin; (E) skin treated with ethosomal cataplasm; (F) skin treated with conventional cataplasm.
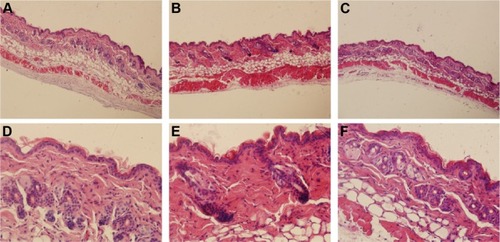
Figure 14 Polarized light microscopic pictures of skins.
Notes: Birefringent structures in unstained skins. (A) Untreated skin; (B) skin treated with ethosomal cataplasm; (C) skin treated with conventional cataplasm. Orientation (independent polarization) pseudocolor microphotographs (100×) of unstained skin: (D) untreated skin; (E) skin treated with ethosomal cataplasm; (F) skin treated with conventional cataplasm. The magnifications of (A–F) are all 100×.
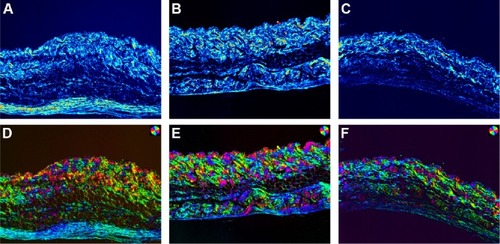
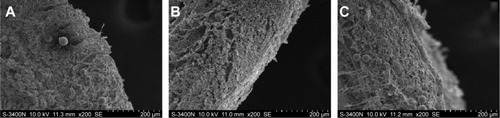
Figure 15 Scanning electron microscope cross-section microphotographs of skins.
Notes: (A) Untreated skin; (B) skin treated with ethosomal cataplasm; (C) skin treated with conventional cataplasm. The magnifications of (A–C) are all 200×.