Figures & data
Figure 1 Imaging of SPIO-labeled autologous cord blood derived cells in a patient with global cerebral ischemia.
Notes: (A) Volume rendering of MRI data of the patient’s head obtained 24 hours posttransplantation. Semiautomatic segmentation is based on pixel intensity, showing the projection of the ventricular system (green) and the distribution of the SPIO signal from the transplanted cells within the occipital horn of the right ventricle (red). Note the supine configuration of the head, corresponding to positioning during surgery. The route and trajectory of cell transplantation via the frontal horn is represented by the needle. (B) Posterior-superior view of the patient’s head, emphasizing the location of the hypointense SPIO signal from autologous cord blood-derived cells transplanted within the occipital horn. (C) T2*-weighted image with an orthogonal view centered on the cellular SPIO signal in the occipital horn (white arrowhead). (D–I) Sagittal T2*-weighted MRI scans showing a longitudinal dispersion of SPIO signal within the occipital horn (white arrowheads); (D) pretransplantation, (E) 24 hours posttransplantation (PT), (F) 7 days PT, (G) 2 months PT, (H) 4 months PT, and (I) 33 months PT.
Abbreviations: SPIO, superparamagnetic iron nanoparticle; MRI, magnetic resonance imaging.
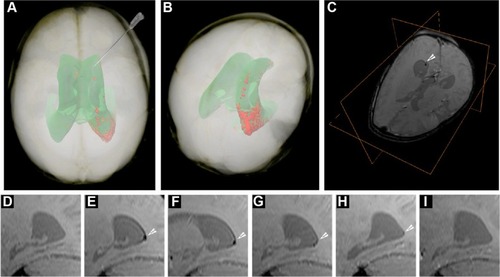
Figure 2 High-resolution MRI images.
Notes: Brain has two tumors, a control (wt) and a glioma expressing a recombinant MRI reporter HSV1-TK, highlighted using CEST imaging.
Abbreviations: MRI, magnetic resonance imaging; HSV1-TK, herpes simplex virus type-1 thymidine kinase; CEST, chemical exchange saturation transfer; h, hour.
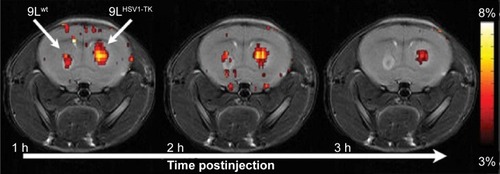
Figure 3 Schematic outline of bioluminescence cells creation and their identification by BLI method in host body after transplantation.
Abbreviation: BLI, bioluminescent imaging.
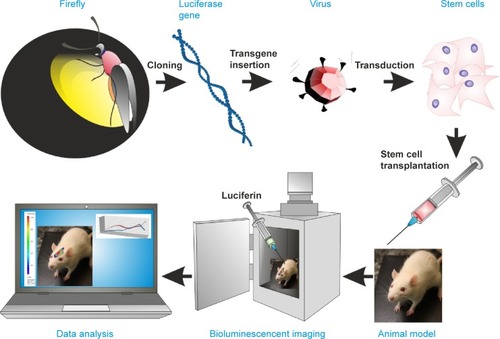
Figure 4 Depiction of the mechanism of optoacoustic imaging.
Note: Copyright © 2015. Reproduced with permission from iThera Medical, (http://www.ithera-medical.com/technology/msot-principle.html).Citation114
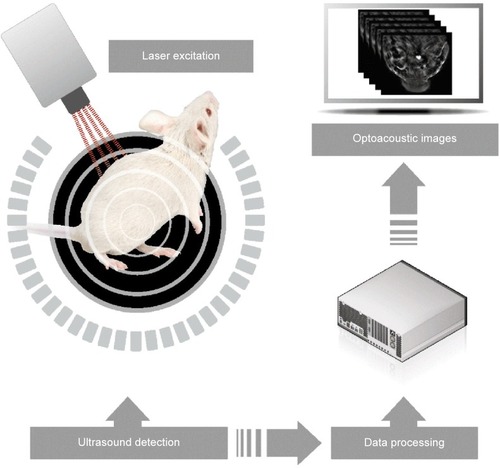
Table 1 Summary of most commonly used techniques for premortem identification of transplanted cells
Table 2 Summary of existing techniques for postmortem identification of transplanted cells
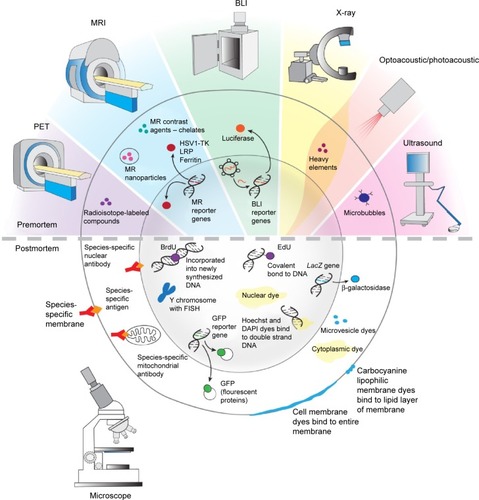
Figure 5 The summary of pre- and postmortem labeling and identification techniques described in detail in text.
Note: Reproduced with permission from © I-Hsun Wu 2014.
Abbreviations: PET, positron emission tomography; BLI, bioluminescent imaging; MRI, magnetic resonance imaging; HSV1-TK, herpes simplex virus type-1 thymidine kinase; LRP, lysine-rich protein; MR, magnetic resonance; EdU, 5-ethynyl-2-deoxyuridine; FISH, fluorescence in situ hybridization; GFP, green fluorescent protein; DAPI, 4′6-diamidino-2-phenylindole; BrdU, 5-bromo-2′-deoxyuridine.