Figures & data
Figure 1 Proton nuclear magnetic resonance spectra (in CDCl3, ppm) of (A) poly(L-lactide), (B) EABoc, (C) 2-N-(t-butoxycarbonyl) ethanolamine-2-oxo-1,3, 2-dioxaphospholane, and (D) poly(aminoethyl ethylene phosphate)/poly(L-lactide) copolymer.
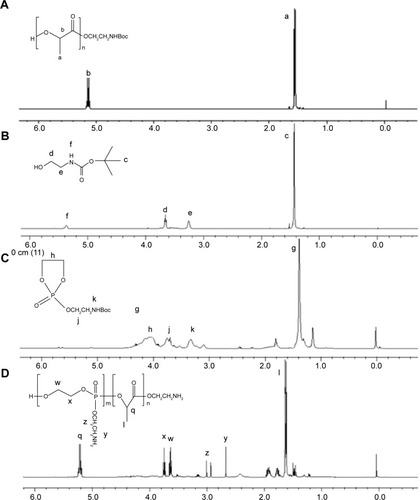
Figure 2 Synthesis procedure of PAEEP-PLLA copolymer.
Abbreviation: PAEEP-PLA, poly(aminoethyl ethylene phosphate)/poly(L-lactide).
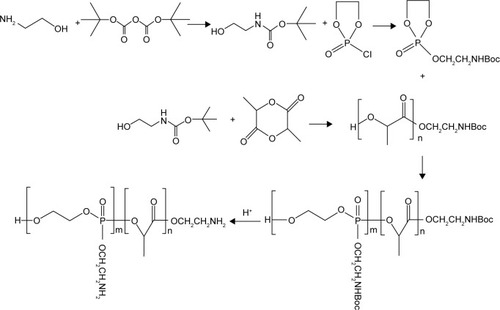
Figure 3 Differential scanning calorimetry (DSC) curve of poly(aminoethyl ethylene phosphate)/poly(L-lactide) copolymer.
Abbreviations: Cp, heat capacity; Tg, glass-transition temperature.
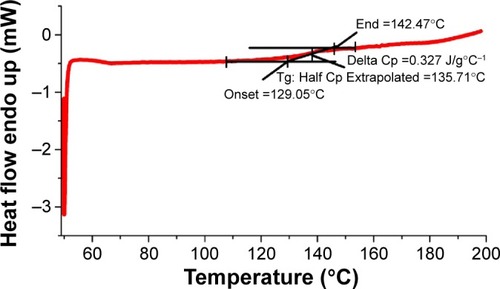
Figure 4 Conjugation of lactoferrin onto the nanobubbles through polyethylene glycol spacers.
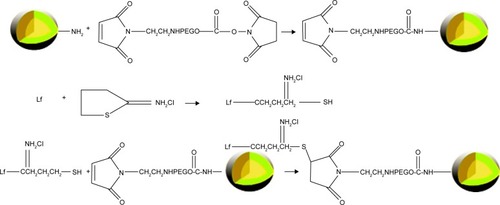
Figure 5 Polyacrylamide gel electrophoresis analysis.
Notes: (A) Poly(aminoethyl ethylene phosphate)/poly(L-lactide) (PAEEP-PLLA) nanobubbles (NBs), (B) free lactoferrin (Lf), (C, D) Lf-conjugated PAEEP-PLLA NBs, and (E) a mixture of free Lf and PAEEP-PLLA NBs.
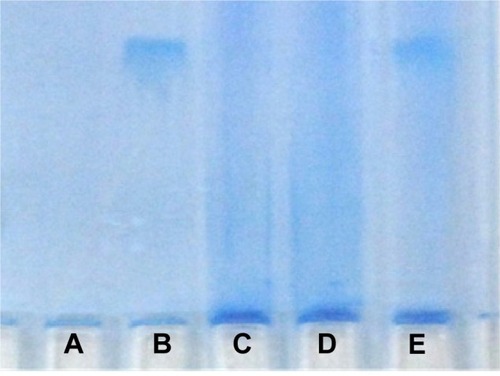
Figure 6 Fourier transform infrared spectra of lactoferrin-conjugated poly(aminoethyl ethylene phosphate)/poly(L-lactide) (Lf-PAEEP-PLLA) and poly(aminoethyl ethylene phosphate)/poly(L-lactide) (PAEEP-PLLA) copolymer.
Note: The red arrows demonstrate the successful conjugation of Lf to NBs.
Abbreviations: Lf, lactoferrin; NBs, nanobubbles.
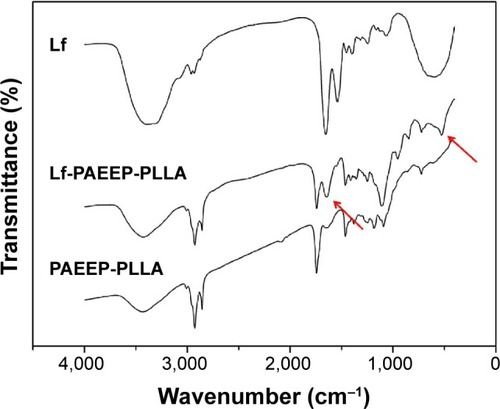
Figure 7 Characterization of lactoferrin-conjugated poly(aminoethyl ethylene phosphate)/poly(L-lactide) nanobubbles: (A) appearance, (B) size distribution, and (C) transmission electron microscopy images.
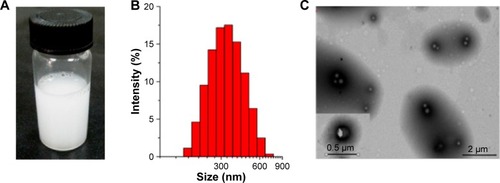
Figure 8 Effect of lactoferrin on the cellular uptake: (A) uptake curves of rat C6 glioma cells, (B) uptake curves of human umbilical vein endothelial cells.
Note: Data are reported as mean ± standard deviation (n=3).
Abbreviations: Lf-PAEEP-PLA, lactoferrin-conjugated poly(aminoethyl ethylene phosphate)/poly(L-lactide); PAEEP-PLA, poly(aminoethyl ethylene phosphate)/poly(L-lactide); MFI, mean fluorescence intensity.
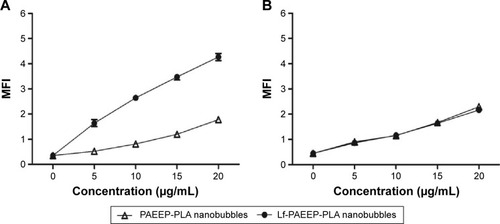
Figure 9 In vitro ultrasonic images of lactoferrin-conjugated poly(aminoethyl ethylene phosphate)/poly(L-lactide) nanobubbles in agarose mold.
Note: The temperature was increased from 20°C to 38°C in 2°C intervals.
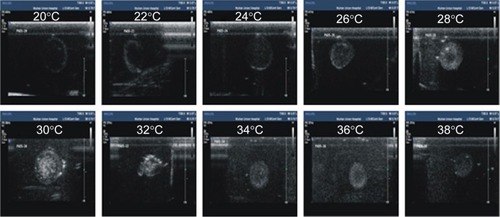
Figure 10 Representative in vitro ultrasonic images.
Notes: (A) The nanobubbles under high-frequency diagnostic ultrasound in agarose mold. (B) Pre-destroyed and (C) post-destroyed of the nanobubbles upon high frequency ultrasound exposure.
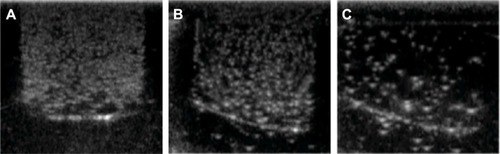
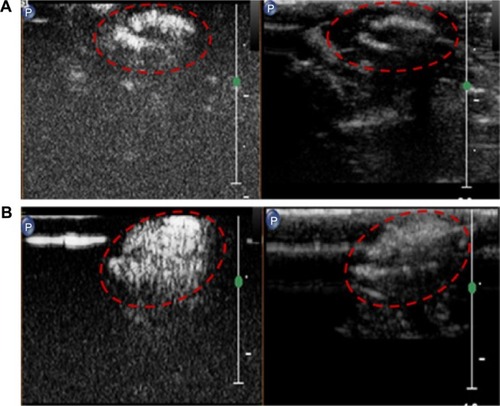
Figure 11 Ultrasound images of subcutaneous tumors (red circles) in BALB/c nude mice.
Notes: (A) 0 second, (B) 30 seconds, (C) 10 minutes, and (D) 120 minutes after injection of lactoferrin-conjugated poly(aminoethyl ethylene phosphate)/poly(L-lactide) nanobubbles.
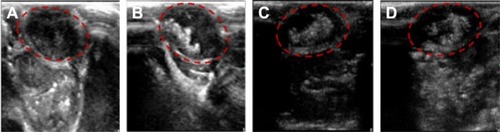
Figure 12 Ultrasound images of subcutaneous tumors (red circles) in BALB/c nude mice after injection of (A) SonoVue® and (B) lactoferrin-conjugated poly(aminoethyl ethylene phosphate)/poly(L-lactide) nanobubbles.