Figures & data
Figure 1 Characterization of the double nanocapsules.
Notes: (A) FTIR spectra of lecithin (a) and PLGA (b). The characteristic peaks of lecithin: CH2, 2.920 cm−1; C=O, 1.740 cm−1; CH3, 1.460 cm−1; P=O, 1.220 cm−1; P–O–C, 1.080 cm−1. The peaks of PLGA: –O–H, 3.448 cm−1; C=O, 1.740 cm−1; C–H, 2.994, 2.920, 1.460, 1.430, and 1.400 cm−1. (B) DLS and (C) TEM images of the nanocapsules. Lecithin was used as the surfactant to form the inner aqueous phase, and PLGA and linoleic acid as the oil phase to prepare the nanocapsules.
Abbreviations: FTIR, Fourier transform infrared spectroscopy; PLGA, poly(lactic-co-glycolic acid); DLS, dynamic light scattering; TEM, transmission electron microscopy.
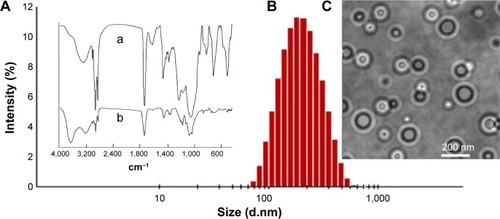
Figure 2 Cell uptake of the nanocapsules in Hela cells.
Notes: (A) Cell uptake process of the nanocapsules consisted of FITC–BSA coating and TRITC–BSA core. (B) Fluorescence images under confocal microscope after 60 minutes of incubation. Nuclei were stained with Hoechst 33258 (blue). Scale bar 20 μm.
Abbreviations: FITC–BSA, fluorescein isothiocyanate–bovine serum albumin; TRITC–BSA, tetramethylrhodamine–bovine serum albumin.
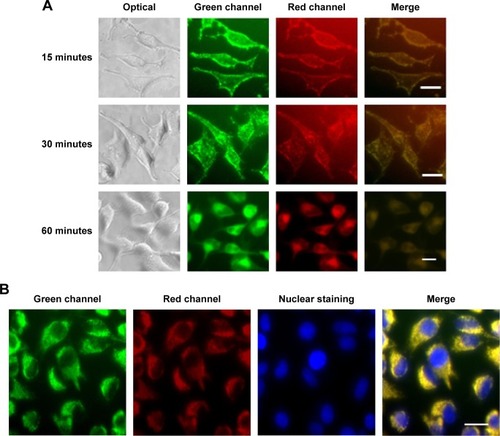
Figure 3 Fluorescence intensities and cytotoxicity of nanocapsules in Hela cells.
Notes: Fluorescence intensities of green (A) and red (B) of cells increased along with the increment of nanocapsule concentrations. FITC–BSA and TRITC–BSA were used as controls, respectively. (C) Cytotoxicity of the nanocapsules with different concentrations by AlamarBlue cell viability assay. The data were expressed as mean ± SEM (n%4).
Abbreviations: FITC–BSA, fluorescein isothiocyanate–bovine serum albumin; TRITC–BSA, tetramethylrhodamine–bovine serum albumin; SEM, standard error of mean.
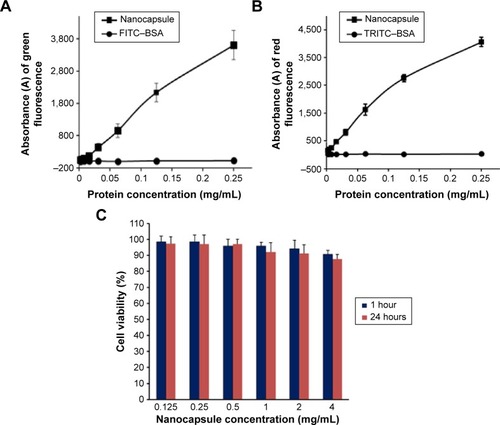
Figure 4 Intercellular delivery of NLS–GFP by the nanocapsules.
Notes: (A) The scheme of preparation of the nanocapsules containing NLS–GFP. (B) Fluorescence distribution in Hela cells after exposure to nanocapsules. NLS could carry GFP into the nucleus after NLS–GFP was transduced into the cytosol. TRITC–BSA on the surface of the nanocapsules was left in the cytosol. Scale bar 20 μm.
Abbreviations: NLS, nuclear location signal; GFP, green fluorescence protein; TRITC–BSA, tetramethylrhodamine–bovine serum albumin.
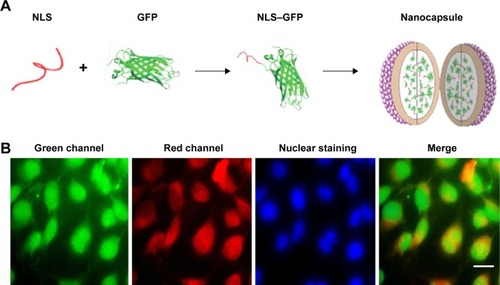
Figure 5 The nanocapsules containing p53-induced cell apoptosis.
Notes: (A) p53 protein expression analyzed by SDS–PAGE. M, protein molecular weight markers; Lane 1, uninduced Escherichia coli harboring pET-28a/p53; Lane 2, the supernatant; Lane 3, the precipitate of induced E. coli harboring pET-28a/p53; Lane 4, purified p53. (B) Growth inhibition rate (%) of Hela cells after treatment with different concentrations of p53 or p53 nanocapsules. The inhibition rate (%) was calculated as the value of (sample – blank)/(control – blank). The cultured cells without any treatment were used as the control and the culture well without cells as the blank. The data were expressed as mean ± SEM (n%4). (C) Hela cells were treated with 50 μg/mL p53 or p53 nanocapsules and observed under optical and fluorescence microscope. Scale bar 20 μm.
Abbreviations: SDA–PAGE, sodium dodecyl sulfate–polyacrylamide gel electrophoresis; SEM, standard error of mean.
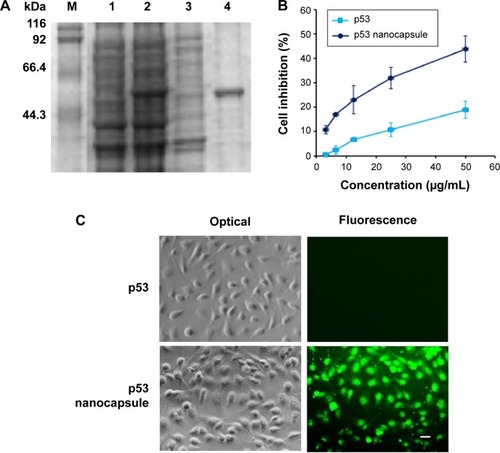
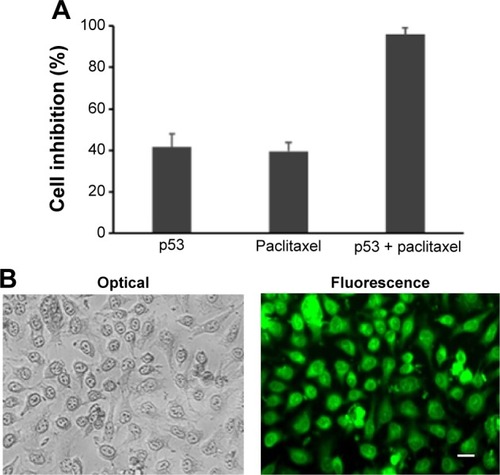
Figure 6 The nanocapsules contained p53 and paclitaxel, which can synergistically induced cell apoptosis.
Notes: (A) Growth inhibition rate (%) of Hela cells after treatment with nanocapsules of p53 (50 μg/mL), paclitaxel (50 μg/mL), or both of them. The data were expressed as mean ± SEM (n%4). (B) Apoptotic cells treated with nanocapsules containing p53 and paclitaxel observed under optical and fluorescence microscope. Scale bar 20 μm.
Abbreviation: SEM, standard error of mean.