Figures & data
Figure 1 Schematic drawing of the position of the implant and the new bone area calculated around the implant.
Notes: (A) Schematic drawing of the distal femur of a rabbit. The implant was inserted into the medullary canal. Lines Prox, Mid, and Dist indicate the proximal, middle, and distal section levels, respectively, for histological evaluation. (B) Schematic representation of the NBA; gray area. The NBA was defined as the gray area within the ring around the implant.
Abbreviation: NBA, new bone area.
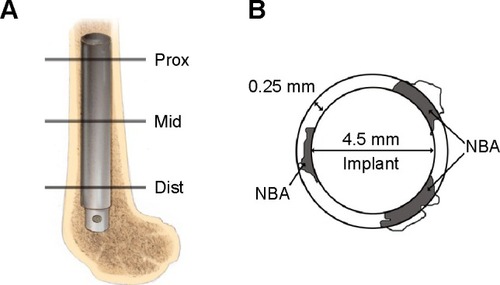
Table 1 Comparison among Ti, USP-Ti in terms of surface properties
Figure 2 Representative SEM image of the USP-Ti surface.
Abbreviations: SEM, scanning electron microscope; Ti, titanium; USP-Ti, Ti surface subjected to USP; USP, ultrasonic shot peening.
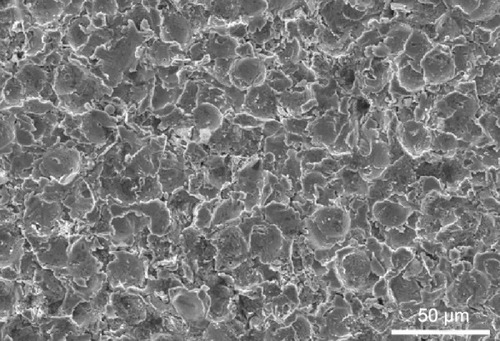
Figure 3 XRD patterns of the USP-Ti surface.
Abbreviations: Ti, titanium; XRD, X-ray diffraction; USP-Ti, Ti surface subjected to USP; USP, ultrasonic shot peening; au,.
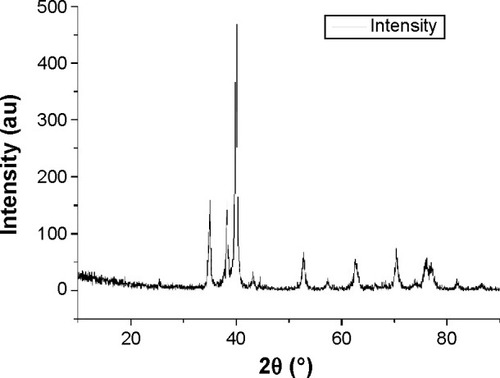
Figure 4 Representative AFM images of the surface (A) Ti and (B) USP-Ti.
Abbreviations: AFM, atomic force microscopy; Ti, titanium; USP-Ti, Ti surface subjected to USP; USP, ultrasonic shot peening.
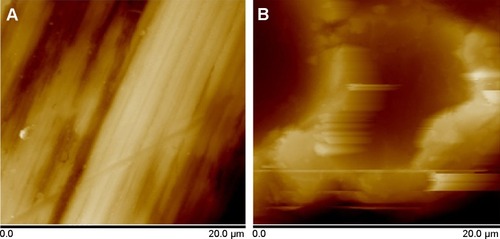
Figure 5 Fluorescence micrographs of osteoblasts (nuclei in blue) incubated on (A) Ti and (B) USP-Ti after 4 hours of culture.
Abbreviations: Ti, titanium; USP-Ti, Ti surface subjected to USP; USP, ultrasonic shot peening.
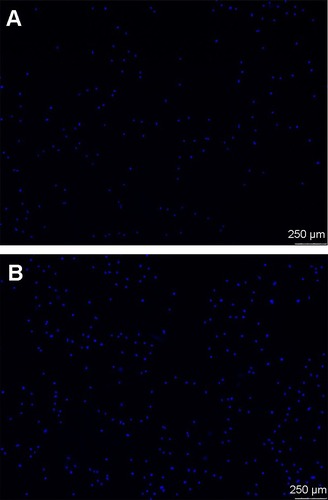
Figure 6 The adhesion, viability, differentiation and calcification of osteoblasts culturing on Ti and USP-Ti.
Notes: Osteoblast adhesion measured by cell counting at 4 hours (A); cell viability of MG63 cells after 1, 4, 8, or 16 days of culture (B); ALP activity (normalized to total protein amounts) at 4, 8, and 16 days (C); and calcium deposition after culture for 8 and 16 days on Ti and USP-Ti surfaces (D). Data are shown as the mean ± SD. *P<0.05 compared with Ti.
Abbreviations: ALP, alkaline phosphatase; USP-Ti, Ti surface subjected to USP; USP, ultrasonic shot peening; SD, standard deviation; Ti, titanium.
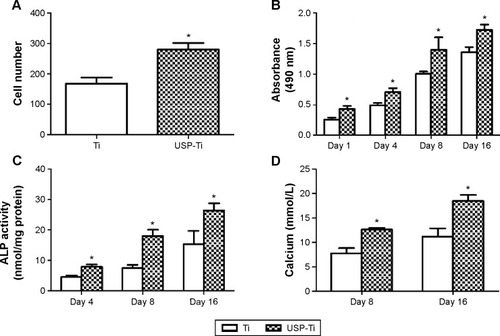
Figure 7 Fluorescence microscopy images of cells double stained with phalloidin for actin filaments (red) and DAPI for nuclei (blue) on Ti (A) and USP-Ti (B) samples.
Abbreviations: USP-Ti, Ti surface subjected to USP; USP, ultrasonic shot peening; Ti, titanium.
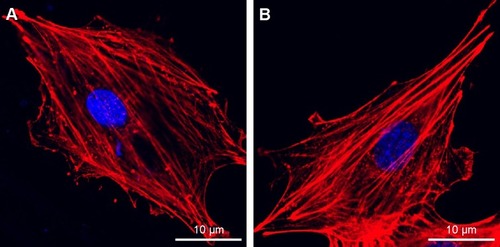
Figure 8 SEM images of osteoblasts after incubating 12 hours on Ti (A) and USP-Ti (B) samples.
Note: The cells are indicated with arrows.
Abbreviations: SEM, scanning electron microscope; USP-Ti, Ti surface subjected to USP; USP, ultrasonic shot peening; Ti, titanium.
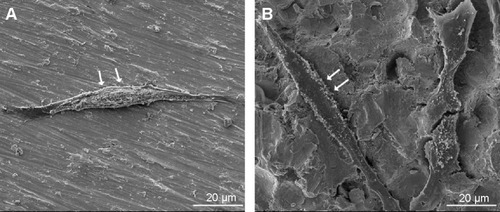
Figure 9 The failure-load values of Ti and USP-Ti at 12 weeks after implantation measured by the pull-out test.
Notes: Data are shown as the mean ± SD. *P<0.05 compared with Ti.
Abbreviations: USP-Ti, Ti surface subjected to USP; USP, ultrasonic shot peening; SD, standard deviation; Ti, titanium.
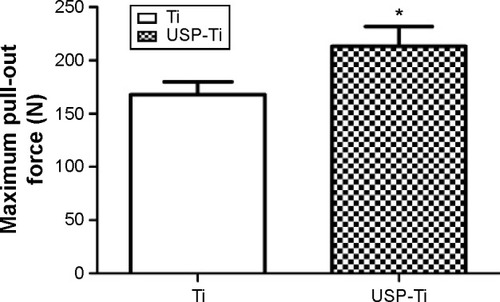
Figure 10 Reconstruction of implants based on Micro-CT.
Notes: Ti (A), USP-Ti (B).
Abbreviations: USP-Ti, Ti surface subjected to USP; USP, ultrasonic shot peening; Ti, titanium.
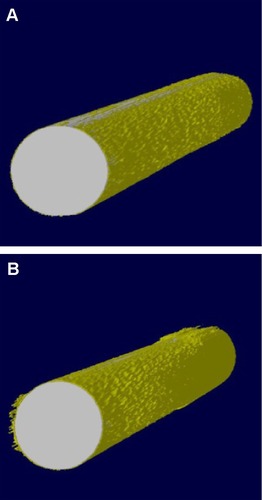
Figure 11 Quantitative results of the Micro-CT evaluation.
Notes: Bone mineral density (A), bone volume fraction (B), trabecular thickness (C), trabecular number (D). Data are shown as the mean ± SD. *P<0.05 compared with Ti.
Abbreviations: USP-Ti, Ti surface subjected to USP; USP, ultrasonic shot peening; SD, standard deviation; Ti, titanium.
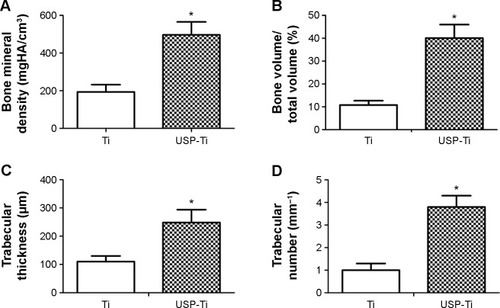
Figure 12 Histological analysis in the middle section stained with methylene blue 12 weeks after implantation.
Notes: The newly formed bone directly contacted the rod surface (arrowheads). Ti (A), USP-Ti (C). Representative images of bone labeling with tetracycline and calcein 12 weeks after implantation. New bone was marked with double yellow–green lines labeled with tetracycline (yellow line) and calcein (green line). Ti (B), USP-Ti (D).
Abbreviations: USP-Ti, Ti surface subjected to USP; USP, ultrasonic shot peening; TC, tetracycline; CL, calcein; Ti, titanium.
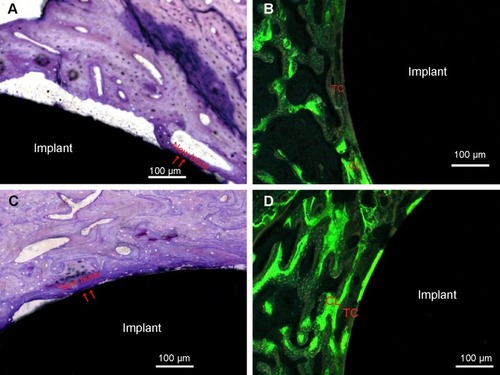
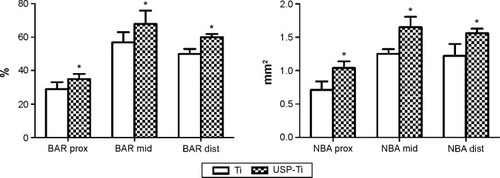
Figure 13 The surface BAR (%) and NBA (mm2) of Ti and USP-Ti in the proximal, middle, and distal sections at 12 weeks.
Notes: Data are shown as the mean ± SD. *P<0.05 compared with Ti.
Abbreviations: USP-Ti, Ti surface subjected to USP; USP, ultrasonic shot peening; BAR, bone apposition ratio; NBA, new bone area; SD, standard deviation; Ti, titanium.