Figures & data
Table 1 Experimental runs showing combinations of factors
Table 2 Observed responses for 12 formulations of experimental design
Table 3 Analysis of variance of multiple regression analysis for the investigated dependent variables
Table 4 Estimated effects and associated P-values for all five dependent variables
Figure 1 Three-dimensional response surface plots showing the effect of the study factors on the dependent variables.
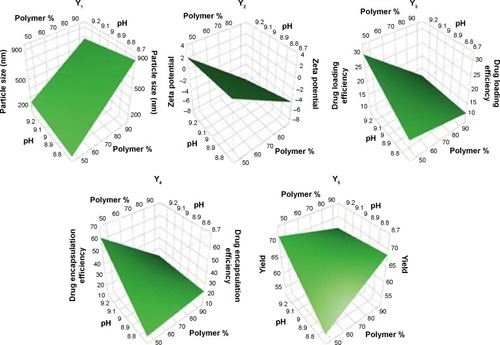
Figure 2 Quantile–quantile plots for predicting the dependent variables.
Abbreviations: RMSE, root-mean-square error.
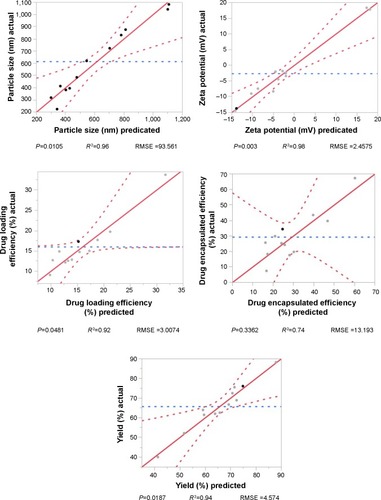
Figure 3 Standard Pareto charts showing the effects of independent variables and their combined effects on mean particle size, zeta potential, drug loading efficiency, drug encapsulation efficiency, and yield.
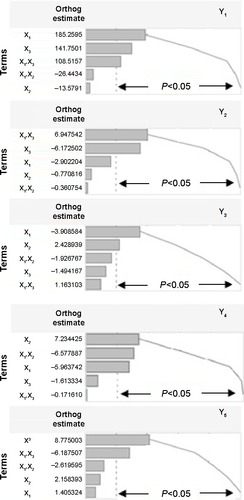
Figure 4 Scanning electron micrograph of optimized atorvastatin–zein formulation.
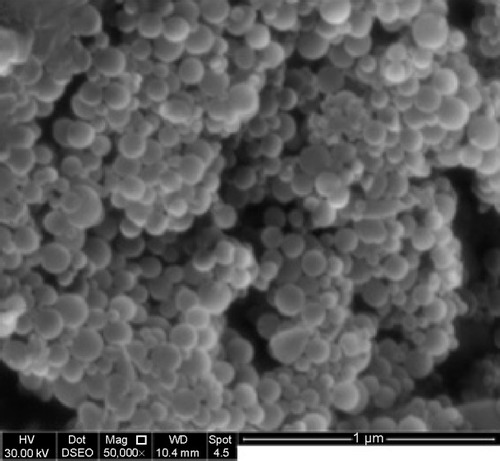
Figure 5 X-ray diffraction patterns of raw atorvastatin and optimized atorvastatin– zein nanospheres.
Abbreviation: ATR, atorvastatin.
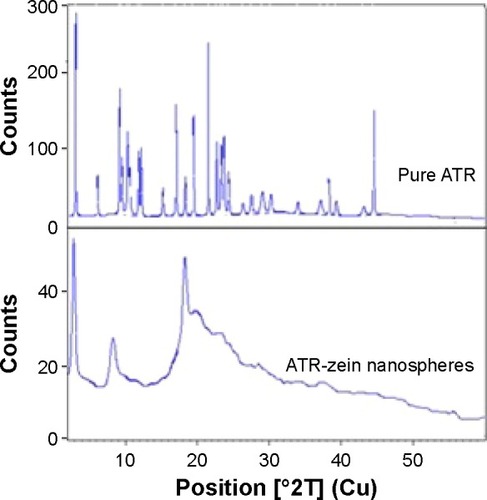
Figure 6 In vitro diffusion of optimized atorvastatin–zein nanospheres.
Abbreviation: ATR, atorvastatin.
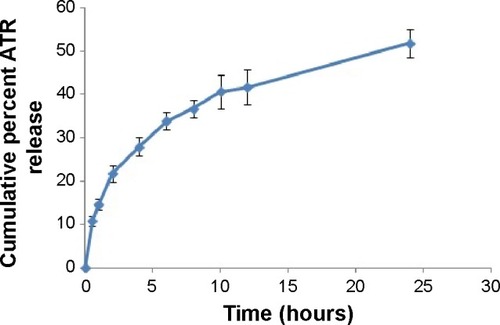
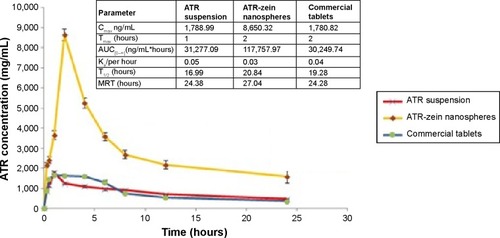
Figure 7 Means of plasma concentration-time profiles and in vivo pharmacokinetic parameters (inset) for optimized atorvastatin–zein nanospheres versus atorvastatin suspension and the commercially available tablets after a 25 mg/kg oral dose of atorvastatin.
Abbreviations: AUC, area under the concentration time curve; ATR, atorvastatin; MRT, mean residence time.