Figures & data
Figure 1 Simvastatin treatment increases active RhoA in D1 cells. Simvastatin constitutively activated RhoA, 0.5–24 hours after treatment.
Notes: Peak activity was reached at 3 hours (A), with RhoA activity increasing in a dose-dependent manner (B), as determined using Western blots of immunoprecipitates. Simvastatin dose-dependently increased RhoA protein levels in the cytosol (aqueous phase) and reduced RhoA content in the membrane (detergent phase) at 3 hours (C). The amount of RhoA that coimmunoprecipitated with RhoGDIα was proportional to the amount of RhoGDIα in the lysate, because simvastatin treatment reduced RhoGDIα-associated RhoA at 3 hours (D). Simvastatin enhanced the ROCK substrate of phospho-MYPT (E) and pMLC (F) at 3 hours. The results are the mean values of three independent measurements, error bars: SEM. *P<0.05; **P<0.01 vs control; #P<0.05, ##P<0.01 vs SIM (1 µm).
Abbreviations: SIM, simvastatin; ROCK, Rho-associated protein kinase; SEM, standard error of the mean; pMLC, phosphomyosin light chain; IP, immunoprecipitation.
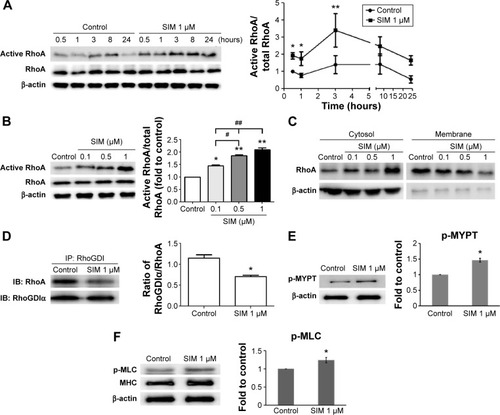
Figure 2 Simvastatin increased actin filament formation, focal adhesions, and cellular tension.
Notes: Immunofluorescence staining showed actin cytoskeleton organization (A) in D1 cells with or without simvastatin, biochemical agents (Y-27632, Bleb, and CD), or simvastatin plus biochemical agents (SIM + Y-27632, SIM + Bleb, and SIM + CD) treatment and vinculin expression (a marker of focal adhesions) (B) with control, simvastatin, SIM + Y-27632, SIM + Bleb, and SIM + CD treatment at 12 hours. Cell rigidity was measured using AFM at 12 hours in control cells and those treated with simvastatin, SIM + Y-27632, SIM + Bleb, and SIM + CD, and was presented as Young’s modulus (green, phalloidin-labeled F-actin; blue, nucleus) (C). **P<0.01 vs control; ##P<0.01 vs SIM (1 µm).
Abbreviations: SIM, simvastatin; Bleb, blebbistatin; CD, cytochalasin D; AFM, atomic force microscopy.
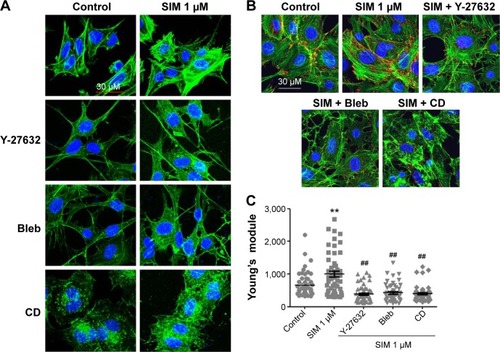
Figure 3 Simvastatin-induced osteogenic gene and protein expression was affected by cytoskeletal alteration agents.
Notes: Disrupting the actin filament organization or decreasing cell rigidity significantly reduced the simvastatin-induced upregulation of osteogenic genes, including Runx2, BMP-2, and OC, 12 (A) and 24 hours (B) after SIM treatment. Immunofluorescence staining revealed simvastatin-induced osteogenic transcription factor Runx2 in the nucleus at 12 (C) and 24 hours (D) and the osteogenic proteins BMP-2 (C) and OC (E) in the cytosol at 24 hours were significantly abrogated by the biochemical agents. Results are mean values of three independent measurements, error bars: SEM. *P<0.05; **P<0.01 vs control; #P<0.05, ##P<0.01 vs SIM (1 µM).
Abbreviations: SIM, simvastatin; Bleb, blebbistatin; CD, cytochalasin D; SEM, standard error of the mean; OC, osteocalcin.
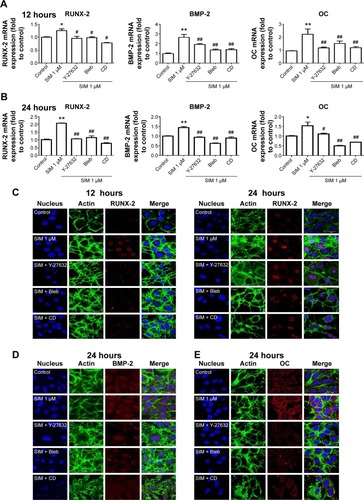
Figure 4 Simvastatin-induced ALP activity and mineralization was reduced by cytoskeletal alteration agents.
Notes: Disrupting actin filament organization or decreasing cell rigidity reduced simvastatin-induced ALP activity on Day 3 (A) and mineralization on Day 5 (B) after treatment. The results are the mean values of three independent measurements, error bars: SEM. **P<0.01 vs control; ##P<0.01 vs SIM (1 µM).
Abbreviations: SIM, simvastatin; Bleb, blebbistatin; CD, cytochalasin D; ALP, alkaline phosphatase; SEM, standard error of the mean.
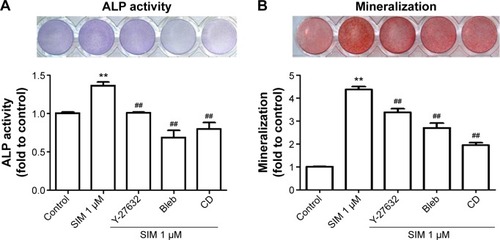
Figure 5 Simvastatin-induced osteogenic differentiation in an animal model of ectopic bone formation was reduced by cytoskeletal alteration agents.
Notes: Immunofluorescence staining revealed that the F-actin, staining with phalloidin, was increased by simvastatin treatment and reduced by cotreatment with biochemical agents, scale bar represents 50 µm (A). Inhibiting actin filament organization or decreasing cell rigidity significantly inhibited simvastatin-induced osteogenic gene expression (B). Representative masses of ectopic bone formation were stained with Alizarin Red S, the 100× figures are represented as the boxed area in the 40× line, and the mineralization of masses was quantified using Image-Pro Plus software (C). The results are the mean values of three independent measurements, error bars: SEM. **P<0.01 vs control; #P<0.05; ##P<0.01 vs SIM (1 µM).
Abbreviations: SIM, simvastatin; Bleb, blebbistatin; CD, cytochalasin D; SEM, standard error of the mean; OC, osteocalcin.
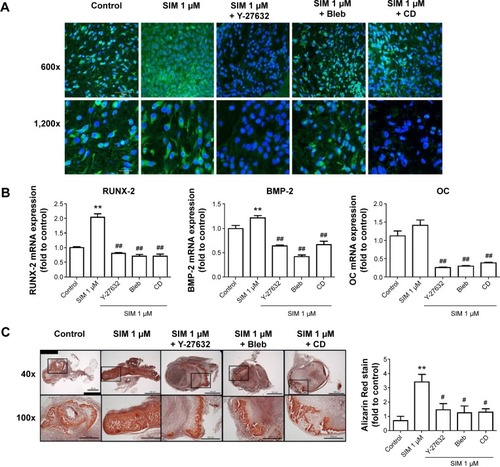
Figure S1 Simvastatin enhanced osteogenesis in D1 cells.
Notes: The LDH cytotoxicity assay after simvastatin treatment at 24 hours (A). Simvastatin increased osteogenic gene expression, including in Runx-2 (B), BMP-2 (C), and osteocalcin (OC) (D) by real-time PCR. Simvastatin dose-dependently increased ALP stain on Day 3 (E) and Alizarin Red S stain on Day 5 (F). *P<0.05; **P<0.01; ##P<0.01 vs SIM (1 µM).
Abbreviations: SIM, simvastatin; ALP, alkaline phosphatase; LDH, lactate dehydrogenase; PCR, polymerase chain reaction.
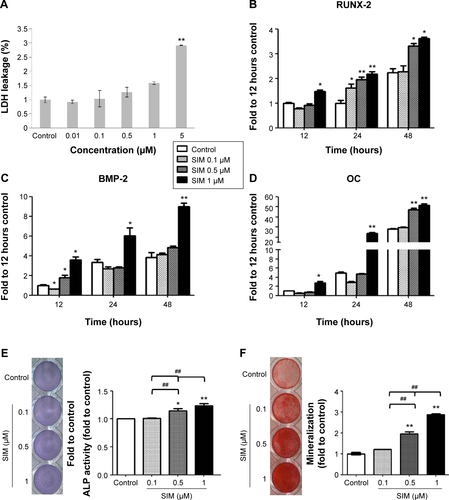
Figure S2 RhoA transfection alters osteogenic differentiation in D1 cells.
Notes: Constitutively active forms of RhoA exhibited more active RhoA and phospho-MLC (A), and then increased osteogenic gene expression (B), and mineralization (C) to more than that of the dominant negative form of RhoA.
Abbreviations: pMLC, phosphomyosin light chain; OC, osteocalcin; GAPDH, glyceraldehyde 3-phosphate dehydrogenase.
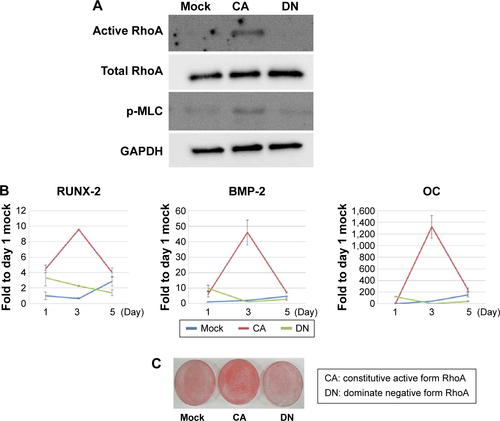
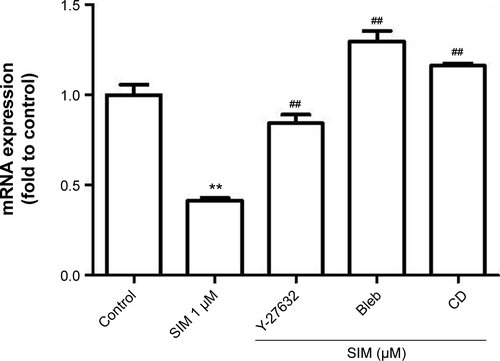
Figure S3 RhoA-signaling blockers restored simvastatin-inhibited PPARγ mRNA levels in D1 cells.
Notes: RhoA-signaling blockers significantly restored simvastatin-inhibited PPARγ gene expression 12 hours after treatment. **P<0.01 vs control; ##P<0.01 vs SIM (1 µM).
Abbreviations: SIM, simvastatin; Bleb, blebbistatin; CD, cytochalasin D; PPARγ, peroxisome proliferator-activated receptor gamma.