Figures & data
Figure 1 Size and morphology of gold nanoparticles. The ultraviolet spectra of gold nanoparticles and transmission electron microscopic analysis (figure inset).
Note: Gold nanoparticles were synthesized following the procedure described by Turkevich et al.Citation30
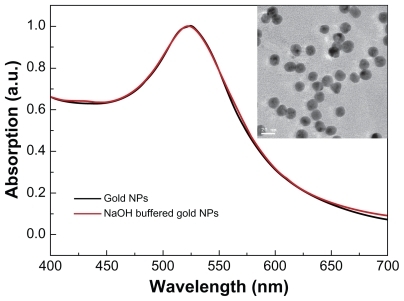
Figure 2 Body weight changes for mice treated with gold nanoparticles at doses of 137.5–2200 μg/kg.
Note: Body weight was measured every two days. Each point represents the mean ± standard deviation of six mice. Data were analyzed by Student’s t-test and the differences between the doses and control group for each organ are not significant (P > 5%).
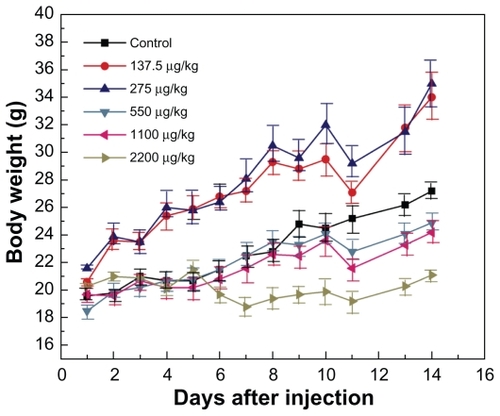
Figure 3 Body weight changes in mice treated with gold nanoparticles 1100 μg/kg by using three administration routes, ie, oral, intraperitoneal, and tail vein injection.
Note: Each point represents mean ± standard deviation. Data were analyzed by Student’s t-test. *Represents significant difference from the control group (P < 0.05).
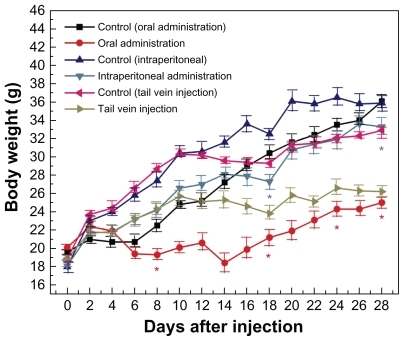
Table 1 A summary of in vivo toxicity of gold nanoparticles
Figure 4 Transmission electron microscopy figures for gold nanoparticles in bone marrow and blood cells 14 days after oral administration at 2200 μg/kg.
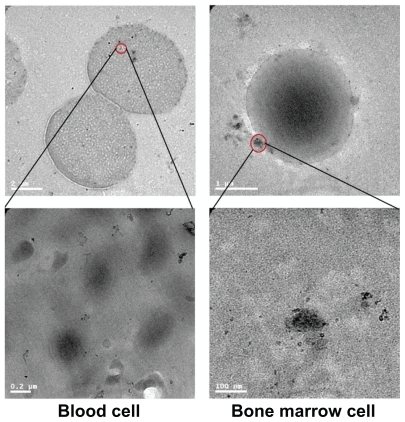
Figure 5 Thymus and spleen indices of mice after oral administration by different doses (137.5–2200 μg/kg) (A) after 14 days and the different injection routes at the dose of 1100 μg/kg (B) after 28 days.
Note: All values are reported as means ± standard deviation. Data were analyzed by Student’s t- test. *Represents significant difference from the control group (P < 0.05).
Abbreviations: ORAL, oral administration; INTER, intraperitoneal injection; TAIL, tail vein injection.
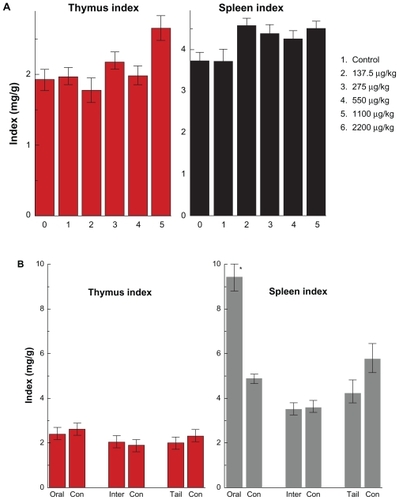
Table 2 Weight of organs for liver, lung, spleen, kidneys, brain, heart, and thymus after oral administration of different doses (137.5–2200 μg/kg) for 14 days
Table 3 Weight of organs for liver, lung, spleen, kidneys, brain, heart, and thymus by using oral, intraperitoneal, and tail vein injection at doses of 1100 μg/kg at 28 days
Figure 6a Hematology results from mice treated with gold nanoparticles and the control group after 14 days oral administration by different doses (137.5–2200 μg/kg).
Note: Bars represent mean ± standard deviation. Data were analyzed by Student’s t-test.
*Represents significant difference from the control group (P < 0.05).
Abbreviations: PLT, platelets; HCT, hematocrit; HGB, hemoglobin; RBC, red blood cells; WBC, white blood cells.
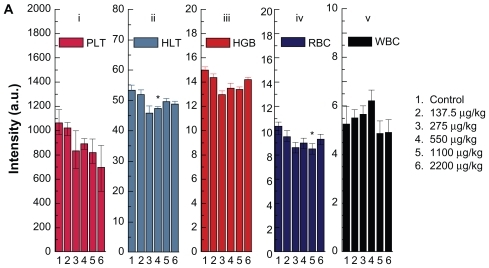
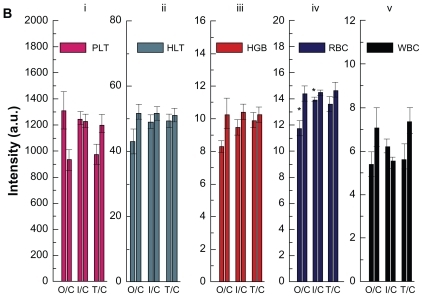
Figure 6b Hematology results from mice treated with gold nanoparticles and control groups after 28 days oral administration, intraperitoneal injection, and tail vein injection at the dose of 1100 μg/kg.
Note: Bars represent mean ± standard deviation. Data were analyzed by Student’s t-test.
*Represents significant difference from the control group (P < 0.05).
Abbreviations: PLT, platelets; HCT, hematocrit; HGB, hemoglobin; RBC, red blood cells; WBC, white blood cells; O/C, oral administration control; I/C, intraperitoneal injection/control; T/C, tail vein injection/control.