Figures & data
Figure 1 Electrospinning and bioelectrospraying association apparatus.
Notes: (A) Polymer solution, (B) cell suspension, (C) positive electrode, (D) negative electrode, and (E) Petri dish on rotating collector plate.
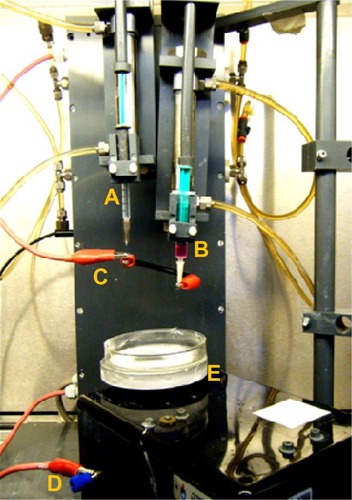
Figure 2 Sample of scaffold containing cells after production.
Note: The arrow shows the more central localization of the electrospraying jet through the width of the scaffold.
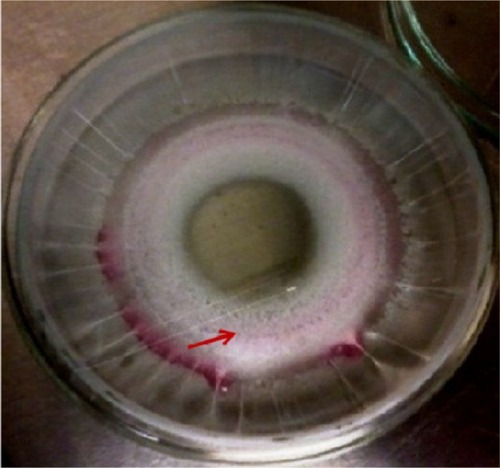
Figure 3 SEM images of (A) control scaffold and (B) scaffolds containing cells immediately after their production.
Note: The yellow arrows indicate presence of cells.
Abbreviation: SEM, scanning electron microscopy.
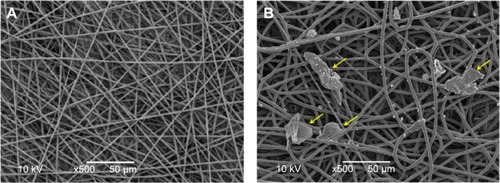
Figure 4 Graph showing decrease of polymer molecular weight measured at different intervals.
Abbreviation: SCC, scaffolds containing cell.
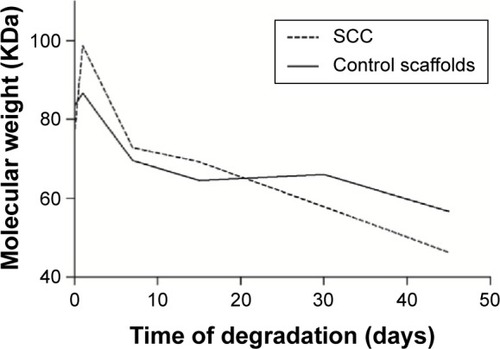
Figure 5 Mechanical properties of CSs and SCCs.
Notes: The panels represent (A) Young’s modulus, (B) maximum load, and (C) maximum elongation. Results are shown as mean ± standard error. *Shows the statistical difference between the groups (P<0.05) according to the Mann–Whitney test.
Abbreviations: CS, control scaffold; SCC, scaffolds containing cell.
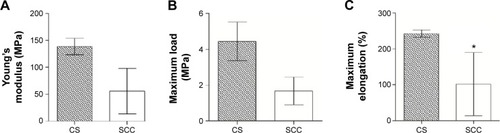
Figure 6 Stress–strain profiles of a representative sample of the CS group and samples of scaffolds containing cells (a, b, c, d, and e).
Abbreviation: CS, control scaffold.

Figure 7 Analysis of cell viability using the MTT test in scaffolds containing cells.
Notes: Results are shown as mean ± standard error. *Shows statistical difference between the groups (P<0.05) according to the ANOVA test followed by the Tukey posttest.
Abbreviations: ANOVA, analysis of variance; MTT, 3-(4,5-dimethylthiazol-2-yl)-2,5-diphenyltetrazolium bromide; h, hours.
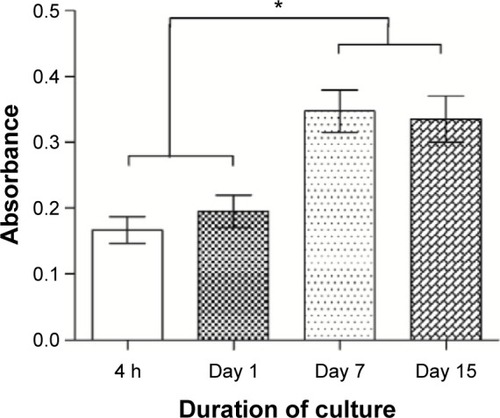
Figure 8 SEM images of scaffolds containing cells.
Notes: Images show scaffolds (A) immediately after their production, (B) after 1 day of cultivation, (C) after 7 days of cultivation, and (D) after 15 days of cultivation.
Abbreviation: SEM, scanning electron microscopy.
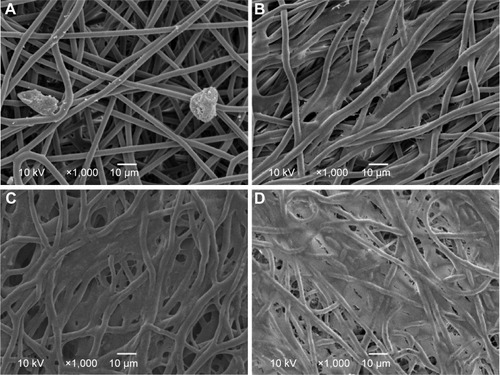
Figure 9 Confocal images of scaffolds containing cells after (A) 1 day, (B) 7 days, and (C) 15 days of cultivation.
Notes: Original magnifications: ×40 with 2× zoom. Scale bars represent 10 um.
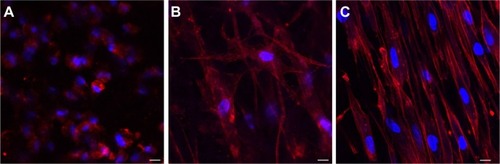
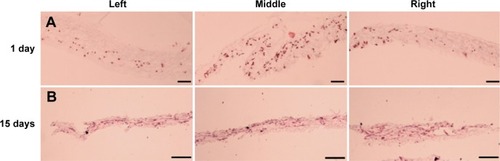
Figure 10 Histological cross-sections of scaffolds containing cells after (A) 1 day of cultivation and (B) 15 days of cultivation.
Notes: (A) Original magnifications: ×200; (B) original magnifications: ×100. Scale bars represent 50 um.