Figures & data
Figure 1 Optical characterization of QDs and bioconjugates.
Notes: Emission (solid lines) and absorption (dashed lines) spectra of (A) green and (B) orange QD. In (C): emission spectra of QDs-anti-H bioconjugates (dashed line) and green bare QDs (solid line). In (D): emission spectra of QDs-anti-A (dashed line) and QDs-anti-B (dotted lines) bioconjugates and orange bare QDs (solid line). The emission spectra were acquired by excitation at 365 nm.
Abbreviation: QDs, quantum dots.
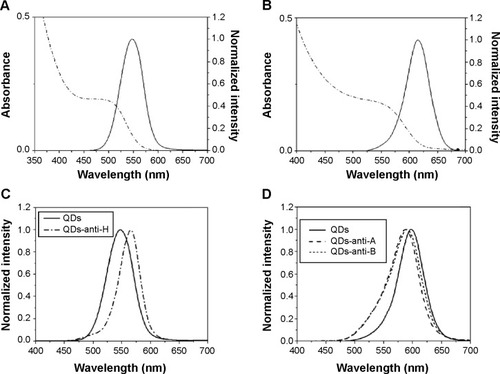
Table 1 Fluorescence microplate assay results of fluorescence intensities and RF percentage of controls (average signal of antibodies and bare QDs) and bioconjugates
Figure 2 PAGE electrophoresis under a UV transilluminator.
Notes: Samples: (A) anti-A; (B) QDs with coupling agents (negative control, bare QDs); and (C) QDs-anti-A.
Abbreviations: PAGE, polyacrylamide gel electrophoresis; QDs, quantum dots; UV, ultraviolet.
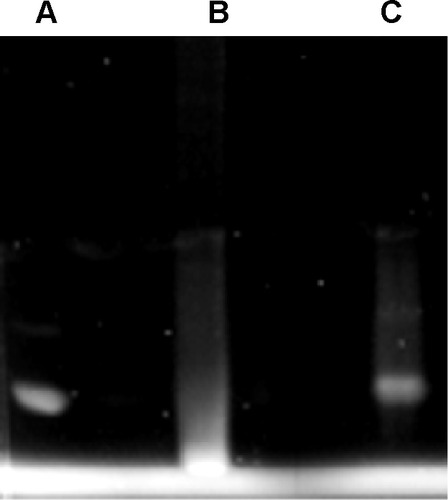
Figure 3 Normalized FCS correlation curves of bare and conjugated QDs.
Notes: (A) FCS curves of bare orange QDs (solid line), QDs-anti-A (dashed line), and QDs-anti-B (dotted line). (B) FCS curves of bare green QDs (solid line) and QDs-anti-H (dashed line).
Abbreviations: FCS, fluorescence correlation spectroscopy; QDs, quantum dots.
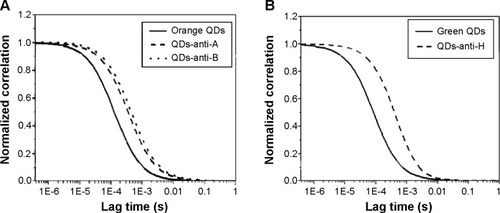
Table 2 Average percentage of ABO blood group red blood cells labeled with conjugated QDs
Figure 4 Typical flow cytometric histogram profiles of RBCs when incubated with QDs conjugated to monoclonal antibodies (blue).
Notes: (A) O RBCs incubated with QDs-anti-A or QDs-anti-B. (B) A1 RBCs incubated with QDs-anti-A. (C) B RBCs incubated with QDs-anti-B. (D and E) A1B RBCs incubated with QDs-anti-A and QDs-anti-B, respectively. Control cells are represented in black. The X-axis represents the detection by FL2 filters (585 nm/21 nm) of the flow cytometer and the Y-axis represents cell counts.
Abbreviations: QDs, quantum dots; RBCs, red blood cells.
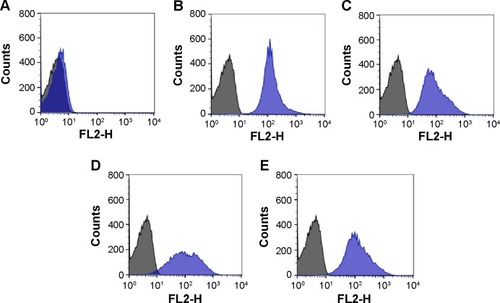
Figure 5 Histogram profiles of RBCs when incubated with QDs-anti-H.
Notes: (A) O and (B) A1 RBCs are represented in blue in the histograms; control cells are represented in black. The X-axis represents FL1 filters (530 nm/15 nm) of the flow cytometer and the Y-axis represents the cell counts.
Abbreviations: QDs, quantum dots; RBCs, red blood cells.
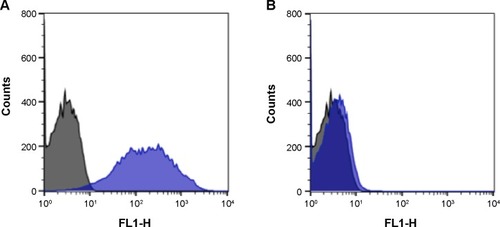
Figure 6 Histogram profiles of (A) A2, (B) A3, and (C) AX RBCs when incubated with QDs-anti-A (blue).
Notes: Control cells are represented in black. The X-axis represents FL2 filters (585 nm/21 nm) of the flow cytometer and the Y-axis represents cell counts.
Abbreviations: QDs, quantum dots; RBCs, red blood cells.
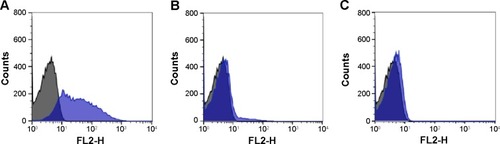
Figure 7 Histogram profiles of (A) A2 and (B) AX RBCs when incubated with QDs-anti-H (blue).
Notes: Control cells are represented in black. The X-axis represents FL1 filters (530 nm/15 nm) of the flow cytometer and the Y-axis represents cell counts.
Abbreviations: QDs, quantum dots; RBCs, red blood cells.
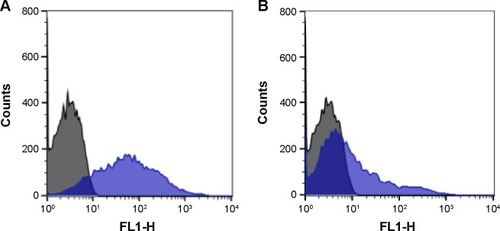
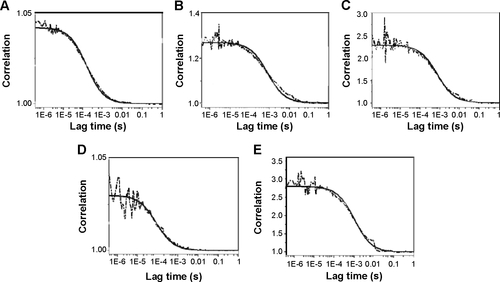
Figure S1 Typical fluorescence correlation spectroscopy curves of QDs and their bioconjugates.
Notes: Correlation curve (dashed line) and a fitting of the correlation curve (solid line) of the systems are represented for (A) orange QDs, (B) QDs-anti-A, (C) QDs-anti-B, (D) green QDs, and (E) QDs-anti-H.
Abbreviation: QDs, quantum dots.