Figures & data
Table 1 Effect of drug concentration, surfactant type, L/D ratio and surfactant to cholesterol molar ratio on entrapment efficiency of carvedilol-loaded niosomes
Table 2 The composition, %EE, zeta potential and particle size of bile salt-enriched niosomal formulations
Figure 1 Morphology of plain (F1) (A), bile salt-enriched (F5) (B), cationic (F7) (C), and anionic (F10) (D) carvedilol-loaded niosomes by AFM.
Abbreviation: AFM, atomic force microscopy.
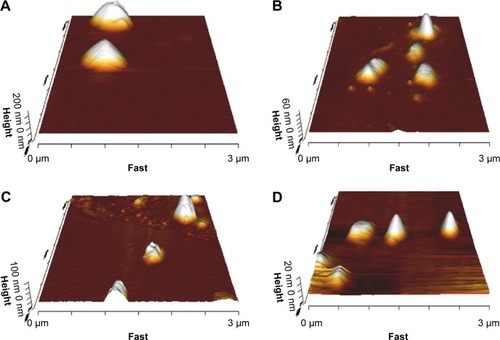
Table 3 The composition, %EE, zeta potential and particle size of niosomal formulations after addition of different charge inducing agents
Figure 2 In vitro release profile of carvedilol from the various formulations in SIF containing Tween 80 (A) or in bile salt release medium (B) at 37°C. Data represent the mean ± SEM (n=3).
Notes: SC20%, 20% SC-enriched niosomes; SC30%, 30% SC-enriched niosomes; STC20%, 20% STC enriched niosomes; STC30%, 30% STC enriched niosomes; CTAB10%, cationic niosomes containing 10% CTAB; DCP10%, anionic niosomes containing 10% DCP.
Abbreviations: CTAB, hexadecyl-trimethyl ammonium bromide; DCP, dicetyl phosphate; PN, Plain niosomes; Susp, suspension; F, formulation; SC, sodium cholate; SEM, standard error of the mean; SIF, simulated intestinal fluid; STC, sodium taurocholate.
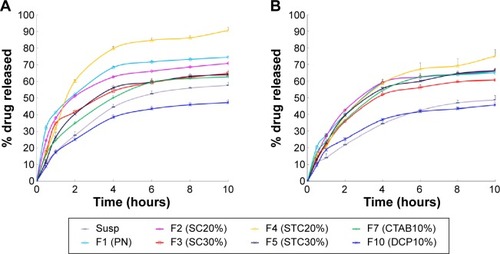
Figure 3 Mean diameter (A), polydispersity index (B) and zeta potential (C) of different niosomal dispersions before and after 10 hours incubation at 37°C in SIF with bile salts.
Notes: Data represent the mean ± SEM (n=3). SC20%, 20% SC-enriched niosomes; SC30%, 30% SC-enriched niosomes; STC20%, 20% STC enriched niosomes; STC30%, 30% STC enriched niosomes; CTAB10%, cationic niosomes containing 10% CTAB; DCP10%, anionic niosomes containing 10% DCP. *P-value <0.05 vs time 0.
Abbreviations: CTAB, hexadecyl-trimethyl ammonium bromide; DCP, dicetyl phosphate; PDI, polydispersity index; PN, Plain niosomes; F, formulation; SC, sodium cholate; SEM, standard error of the mean; SIF, simulated intestinal fluid; STC, sodium taurocholate.
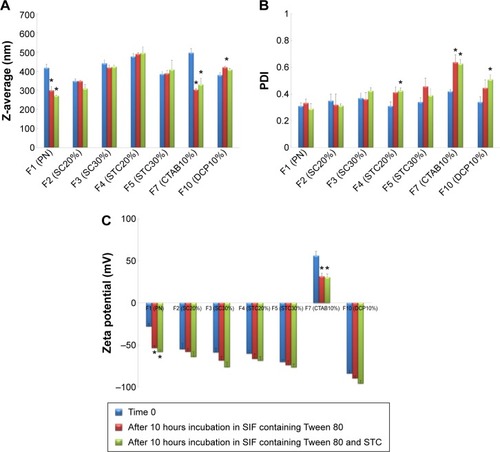
Table 4 Pharmacokinetic parameters of carvedilol after oral administration of various formulations to male Wistar rats
Figure 4 The mean plasma concentration of carvedilol after a single oral dose (8 mg/kg) of plain (A), bile salt-enriched (B) or charged niosomes (C) compared to carvedilol suspension in rats (n=6, mean ± SEM).
Notes: SC20%, 20% SC-enriched niosomes; SC30%, 30% SC-enriched niosomes; STC20%, 20% STC enriched niosomes; STC30%, 30% STC enriched niosomes; CTAB10%, cationic niosomes containing 10% CTAB; DCP10%, anionic niosomes containing 10% DCP.
Abbreviations: CTAB, hexadecyl-trimethyl ammonium bromide; DCP, dicetyl phosphate; PN, plain niosomes; Susp, suspension; F, formulation; SC, sodium cholate; SEM, standard error of the mean; STC, sodium taurocholate.
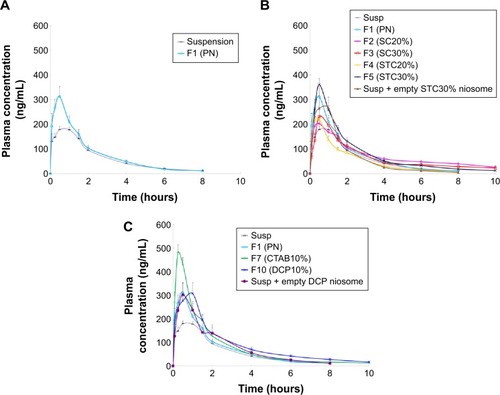
Figure 5 The mean plasma concentrations of carvedilol (A) and AUC (B) after oral administration of niosomes to Wistar rats pretreated with cycloheximide (n=6, mean ± SEM) (*P<0.05 vs control).
Notes: SC20%: 20% SC-enriched niosomes; DCP10%: anionic niosomes containing 10% DCP.
Abbreviations: AUC, area under the drug concentration–time curve; F, formulation; DCP, dicetyl phosphate; SC, sodium cholate; SEM, standard error of the mean.
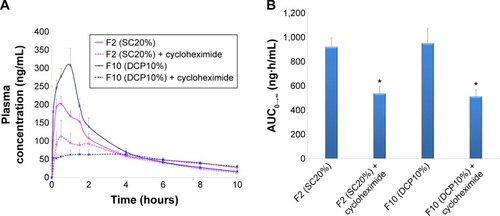
Figure 6 Hematoxylin and eosin staining of small intestinal segments from Wistar rats after oral administration of phosphate buffered saline (A), 20% SC-enriched vesicles (B) and DCP-containing niosomes (C).
Note: Magnification ×100.
Abbreviations: DCP, dicetyl phosphate; SC, sodium cholate.
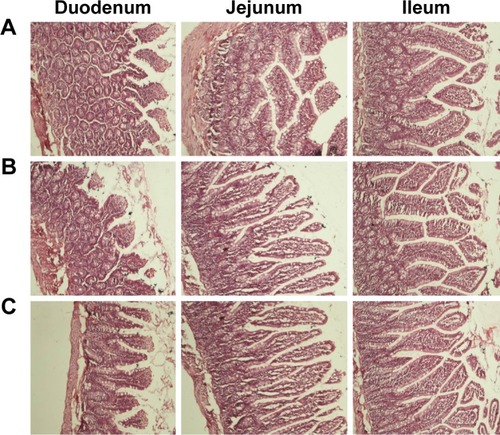
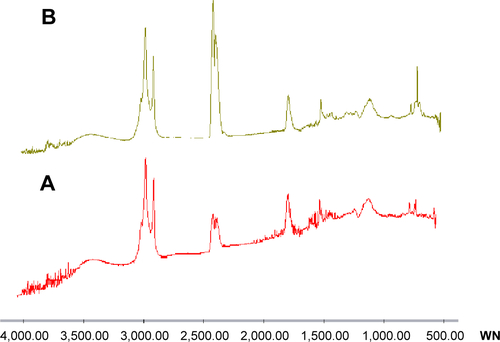
Figure S1 FTIR spectra of empty niosomes (A), carvedilol-loaded niosomes (B).
Abbreviations: FTIR, Fourier transform infrared; WN, Wavenumber.