Figures & data
Figure 1 Δf and ΔD responses upon STV adsorption and subsequent binding of SBP displaying phage SR21 (A and C) and non-SBP displaying CR21 (B and D) to the Au-coated QCM-D sensors. The red arrows indicate the time of addition of the sample.
Abbreviations: STV, streptavidin; SBP, streptavidin-binding protein; QCM-D, quartz crystal microbalance with dissipation monitoring.
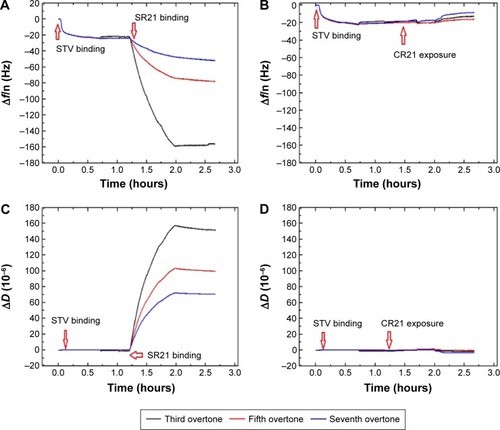
Figure 2 Kinetic study on the phage immobilization.
Notes: (A) ΔD – Δf plots showing adsorption of STV (black solid line) and SBP displaying phage SR21 (red solid line). (B) Estimated thickness of the SBP displaying phage SR21 layer. The red arrows indicate the time of addition of the sample.
Abbreviations: STV, streptavidin; SBP, streptavidin-binding protein.
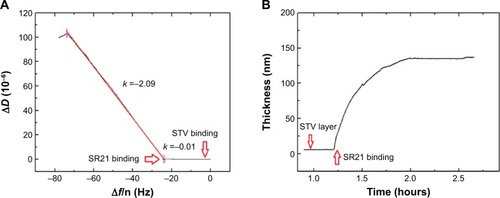
Figure 3 Kinetics of adsorption of STV to Au-coated QCM-D sensors and subsequent binding of SBP displaying phage SR21.
Notes: The blue and red solid lines represent the fits to EquationEquation 1(1) : Δf = Δf0 + Ae−1/τ. The black line is experimental data. The red arrows indicate the time of addition of the sample.
Abbreviations: STV, streptavidin; QCM-D, quartz crystal microbalance with dissipation monitoring; SBP, streptavidin-binding protein; A, amplitude; τ, time constant.
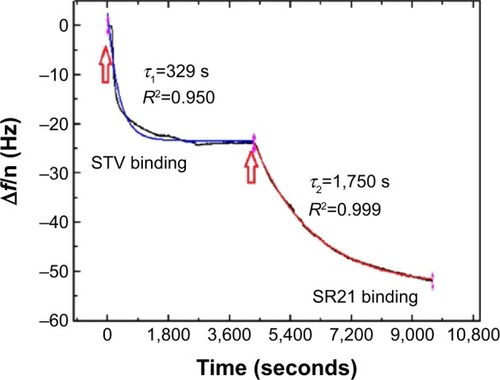
Figure 4 Characterization of SBP displaying phage binding to the streptavidin surfaces using SPR.
Notes: (A) The SBP displaying phage (SR21 and SB) binds to the STV surface of a SA chip and non-SBP displaying phage (CR21, CB) shows no binding pattern. (B) shows the real-time binding curves, and SBP displayers show high stability when flushing with buffer while the negatives revert back to the base line due to the buffer effect.
Abbreviations: SBP, streptavidin-binding protein; SPR, surface plasmon resonance; STV, streptavidin.
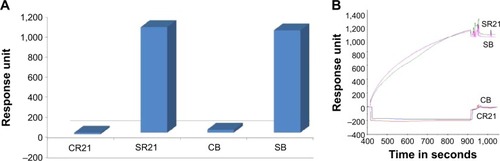
Figure 5 Characterization of antihuman IgG adsorption and subsequent binding of positive complex (A and C) and negative complex (B and D) to the Au-coated QCM-D sensors. The arrows indicate the time of addition of the sample.
Abbreviation: QCM-D, quartz crystal microbalance with dissipation monitoring.
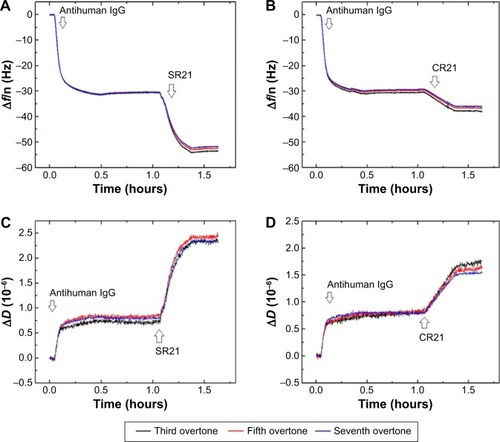
Figure 6 Binding of positive and negative complexes onto the antihuman IgG surface.
Notes: ΔD – Δf plots for overtone seven on antihuman IgG adsorption (blue solid line is a linear fit with slope kD–f) and binding of positive complex (A) and negative complex (B) (red solid line is a linear fit with slope kD–f). (C and D) Estimated thickness of the positive complex and the negative complex layers, respectively. The arrows indicate the time of addition of the sample.
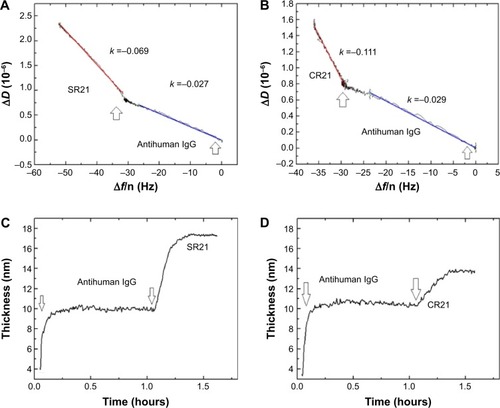
Figure 7 Kinetic study on adsorption of IgG to Au-coated QCM-D sensors and subsequent binding of positive complex (A) and negative complex (B) for overtone seven.
Notes: The solid lines represent the fits to EquationEquation 1(1) : Δf = Δf0 + Ae−1/τ. The arrows indicate the time of addition of the sample.
Abbreviations: QCM-D, quartz crystal microbalance with dissipation monitoring; A, amplitude; τ, time constant.
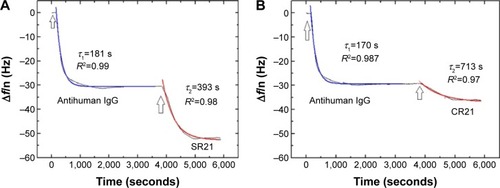
Figure S1 STV adsorption on Au-coated QCM-D sensors and subsequent binding of SBP displaying phage SB.
Notes: (A and B) Show the Δf and ΔD responses, respectively, and (C and D) representing the kinetics study on the STV and SB phage binding.
Abbreviations: STV, streptavidin; QCM-D, quartz crystal microbalance with dissipation monitoring; SBP, streptavidin-binding protein.
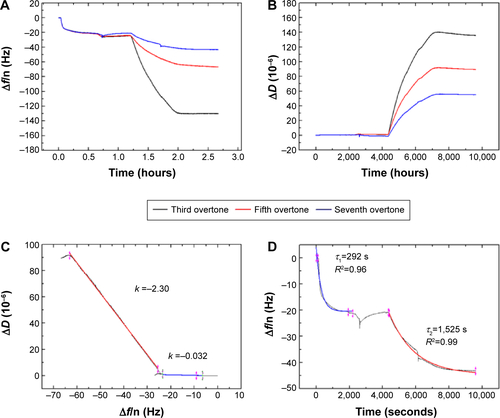
Figure S2 STV adsorption on Au-coated QCM-D sensors and subsequent binding of non-SBP displaying phage CB.
Notes: (A and B) Show the Δf and ΔD responses, respectively.
Abbreviations: STV, streptavidin; QCM-D, quartz crystal microbalance with dissipation monitoring; SBP, streptavidin-binding protein.
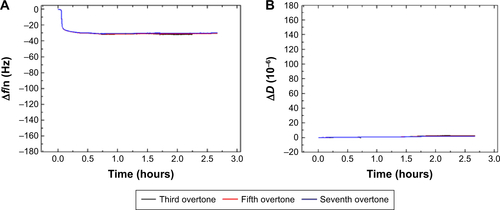
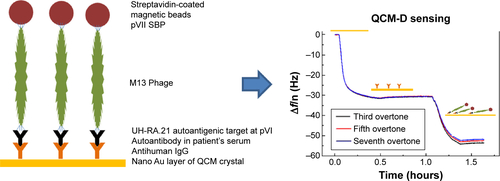
Figure S3 Schematic diagram of the dual-display phage sensor and the change in the frequency Δf with time upon binding of antihuman IgGand the phage complex on QCM-D.
Abbreviations: QCM-D, quartz crystal microbalance with dissipation monitoring; SBP, streptavidin-binding protein.