Figures & data
Figure 1 The time of Doxil administration during mouse estrous cycle and its effects on drug retention in 4T1 tumors. A) The Dox concentrations in 4T1 tumors when Doxil is injected during diestrus stage or other estrous stages. B) The dynamic changes of serum progesterone and estrogen levels during the estrous cycle. The concentrations of P4 and E2 in mice were previously published.Citation13 The best time for Doxil injection is indicated by the black arrow and bar. The worst times for Doxil injection are indicated by small triangles and dotted bars.
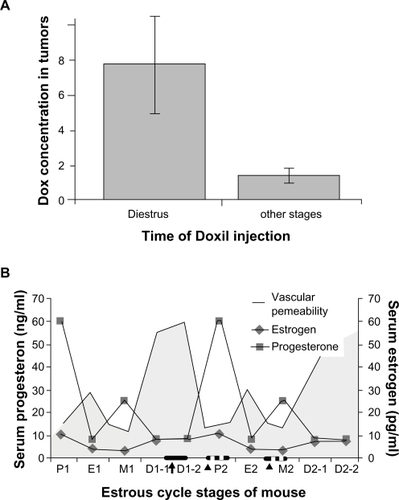
Figure 2 Doxil administration and its effects on the growth of 4T1 tumors and estrous cycle of tumor-bearing mice. A) Length of estrous cycles that occur before and after Doxil injection. B) Length of estrous cycle stages in control and tumor-bearing mice prior to and after Doxil administration. C) Effect of Doxil treatment on 4T1 tumor size.
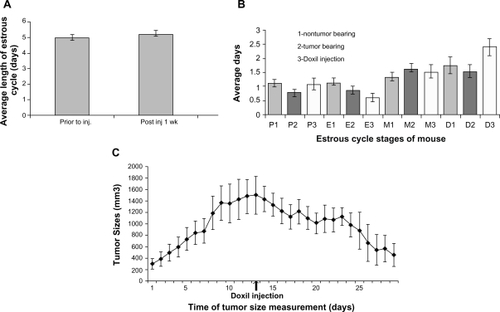
Figure 3 Immunohistochemical analysis of PR and mPRα protein expression in 4T1 tumor tissues. A) 4T1 tumor stained with H & E. B) Negative control of 4T1 tumor tissue stained without primary antibody. Magnification of all images is 400×. C) 4T1 tumor tissue stained with anti-PR. D) 4T1 tumor tissue stained with anti-mPRα.
Abbreviations: H & E, hematoxylin & eosin; PR, progesterone receptor; 4TI, mouse mammary cell line.
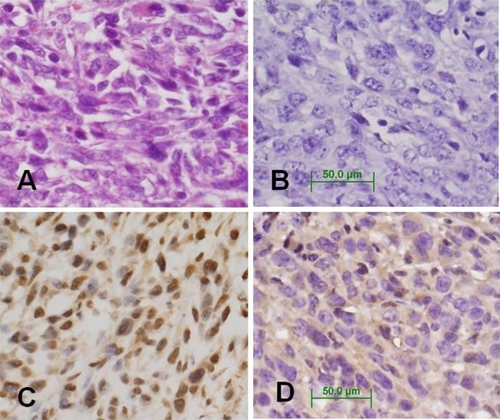
Figure 4 P4 treatment and cytokine expression in vitro. Scanned signal intensity of the hybridized protein array spots from a cytokine microarray assay of conditioned medium from 4T1 mouse mammary cell cultures treated with progesterone for 24 hours. Each bar represents the average values from two hybridized spots of duplicate assays with subtraction of the baseline reading (baseline reading value = 100).
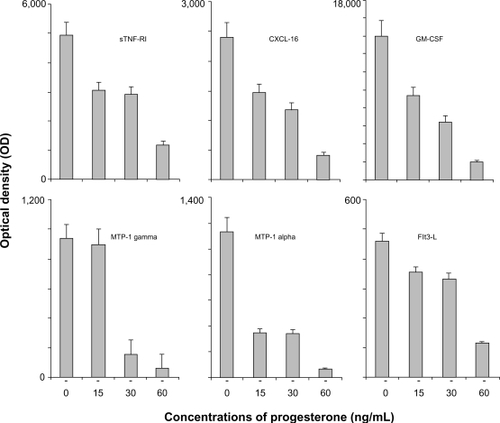
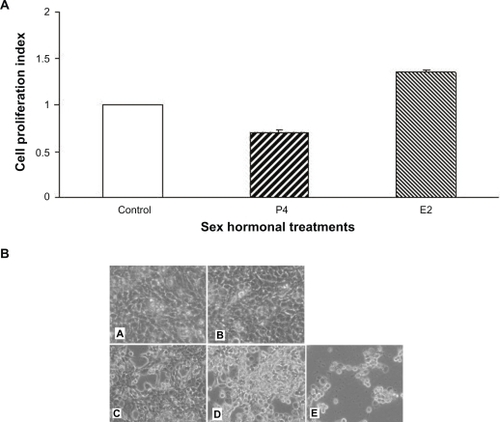
Figure 5 Effect of sex hormones on cell proliferation and cell death in vitro. A) Cell proliferation index measured for 4T1 cultures treated with P4 or E2, compared to controls. The data were obtained from three experiments. B) Appearance of 4T1 cultures treated with various doses of P4. A. control; B. E2; C. P4 15 ng/ML; D. P4 30 ng/ML; E, P4 60 ng/ml. Magnification of all images is 100×.
Abbreviation: 4TI, mouse mammary cell lines.