Figures & data
Table 1 Concentration of PCL and LNC used in Caenorhabditis elegans during acute treatment
Table 2 Physicochemical characterization of LNC and Mel-LNC (batch of three samples)
Figure 1 Granulometric profile (laser diffraction).
Notes: (A) Unloaded lipid-core nanocapsules. (B) Melatonin-loaded lipid-core nanocapsules.
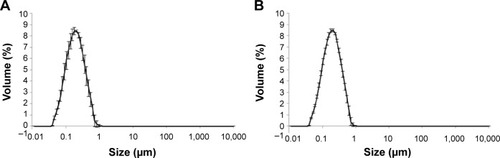
Figure 2 Microscope images (400× magnification) of worms exposed to RhoB-labeled Mel-LNC.
Notes: (A) Control worm (treated with saline solution). (B) Worm fluorescence image after 30 minutes of treatment, indicating an oral uptake. (C) Fluorescence image of worm 3 hours posttreatment, showing the distribution in the worm body. (D–F) Phase contrast microscopy images of worms; images were acquired at 400× magnification.
Abbreviations: Mel-LNC, melatonin-loaded lipid-core nanocapsules; RhoB, Rhodamine B.
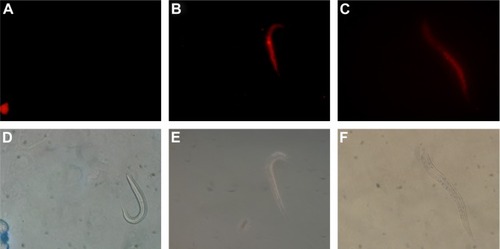
Figure 3 Log dose–response curve for lethal dose 50% determination of lipid-core nanocapsules after acute treatment.
Note: Data are expressed as mean ± standard deviation.
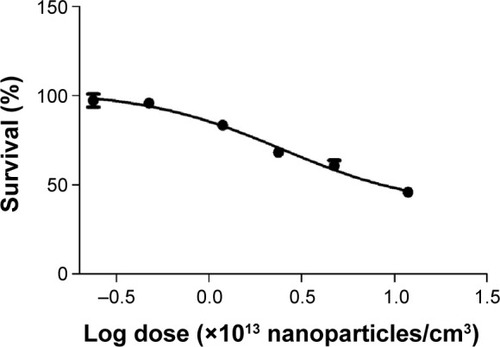
Figure 4 Body areas of Caenorhabditis elegans after acute treatment with LNC in different concentrations.
Notes: (A) Control group. (B) Group III (11.85×10¹² LNC/mL). (C) Group VI 118.5×10¹² LNC/mL). (D) Graphical representation of concentration (LNC/mL) × body area (µm2). *P<0.01 compared with control group.
Abbreviation: LNC, unloaded lipid-core nanocapsules.
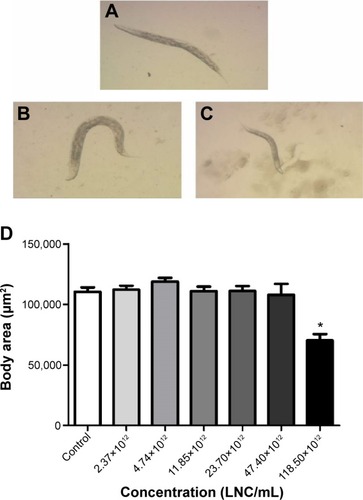
Figure 5 Reactive oxygen species production assessment after exposure with lipid-core nanocapsules in acute treatment.
Note: *P<0.01 compared to the control group.
Abbreviation: DCF, dichlorofluorescein.
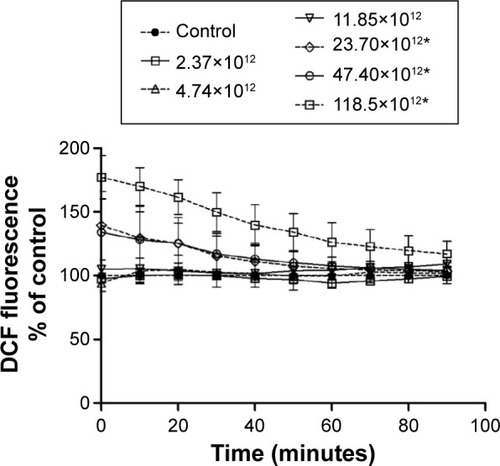
Figure 6 Survival rate of worms pretreated with Mel-LNC and Mel after PQ exposure.
Notes: Control group was exposed to M9 buffer. *P<0.01 compared to the control group; #P<0.01 compared to the PQ group.
Abbreviations: Mel, free melatonin aqueous solution; Mel-LNC, melatonin-loaded lipid-core nanocapsules; PQ, paraquat; LNC, unloaded lipid-core nanocapsules.
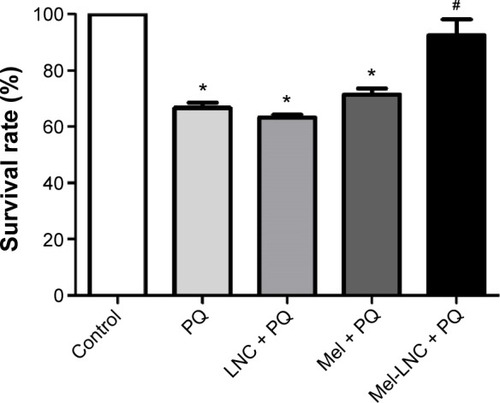
Figure 7 Mel-LNC pretreatment protected Caenorhabditis elegans from abnormal development caused by PQ-poisoning.
Notes: (A) Control group. (B) Paraquat group. (C) LNC + PQ group. (D) Mel + PQ group. (E) Mel-LNC + PQ group. (F) Graphical representation of statistic difference among the groups. *P<0.01compared to the control group; #P<0.01 compared to the PQ group.
Abbreviations: LNC, unloaded lipid-core nanocapsules; Mel, free melatonin aqueous solution; Mel-LNC, melatonin-loaded lipid-core nanocapsules; PQ, paraquat.
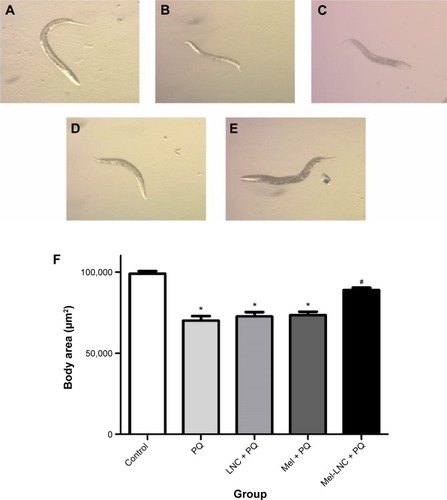
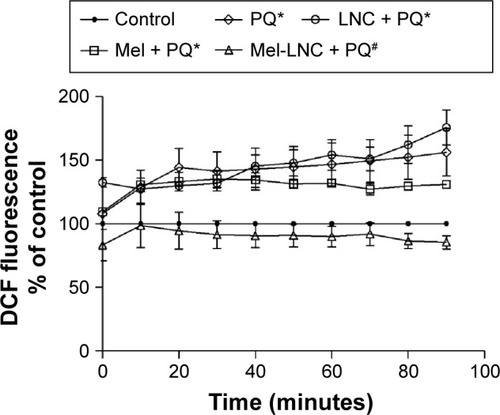
Figure 8 Pretreatment with Mel-LNC protected against PQ-induced ROS production in Caenorhabditis elegans.
Notes: ROS were measured by DCF-DA assay. *P<0.01 compared to control group (treated with saline solution). #P<0.01 compared to the Mel + PQ group and PQ group.
Abbreviations: DCF, dichlorofluorescein; DCF-DA, 2′,7′-dichlorofluorescein diacetate; LNC, unloaded lipid-core nanocapsules; Mel, free melatonin aqueous solution; Mel-LNC, melatonin-loaded lipid-core nanocapsules; PQ, paraquat; ROS, reactive oxygen species.