Figures & data
Figure 1 Schematic illustration of nanoparticle synthesis and delivery procedure.
Notes: (A) Cell-penetrating peptides (TAT) were linked using MAL-PEG-NHS. Paramagnetic Gd3+ ions were chelated with p-SCN-Bn-DTPA conjugated with dendrigraft poly-L-lysine. (B) Nanoparticles were injected intratumorally, and diffused by crossing the stroma, endocytosis, and exocytosis in the tumor microenvironment, all of which were monitored by magnetic resonance imaging.
Abbreviations: Gd, gadolinium; MAL, maleimide; NHS, N-hydroxysuccinimide; PEG, polyethylene glycol; PBS, phosphate-buffered saline; p-SCN-Bn-DTPA, 2-(4-isothiocyanatobenzyl)-diethylenetriaminepentaacetic acid.
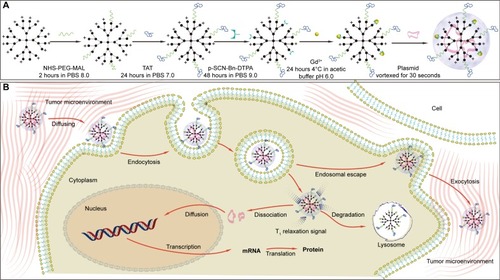
Figure 2 Nanoparticle characterization.
Notes: (A) 1H nuclear magnetic resonance spectra for DTPA-DGL-PEG-TAT. (B) Diameter distribution of Gd-DPT/pRFP. (C) Atomic force microscopy image of Gd-DPT/pRFP. (D) Relaxivity (r1) measurement for Gd-DTPA (3.92 mM−1s−1), Gd-DP/pRFP (0.91 mM−1s−1), and Gd-DPT/pRFP (0.88 mM−1s−1).
Abbreviations: Gd, gadolinium; DGL, dendrigraft poly-L-lysine; PEG, polyethylene glycol; pRFP, plasmid red fluorescence protein; DTPA, gadopentetate dimeglumine; DP, DTPA-DGL-PEG; DPT, DTPA-DGL-PEG-TAT.
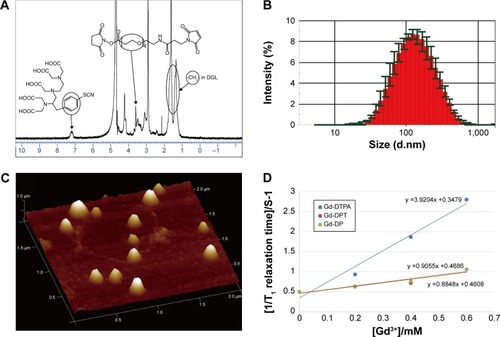
Figure 3 Gene transfection.
Notes: (A) Fluorescent images of RFP expression taken 48 hours after transfection with Gd-DTPA/pRFP (Gd-DTPA), Gd-DGL/pRFP (Gd-D), Gd-DP/pRFP (Gd-DP), and Gd-DPT/pRFP (Gd-DPT). Original magnification, 200×. (B) Luciferase expression 48 hours after administration of Lipofectamine 2000, polyethylenimine, Gd-DTPA, Gd-D, Gd-DP, and Gd-DPT in MIA PaCa-2 cells is plotted as light units per mg protein. *P<0.05, **P>0.05. In vivo distribution (C) and quantitative analysis (D) of transgene loaded by Gd-DTPA/pLuci (Gd-DTPA), Gd-DP/pLuci (Gd-DP), and Gd-DPT/pLuci (Gd-DPT), after intratumoral injection.
Abbreviations: Gd, gadolinium; DGL, dendrigraft poly-L-lysine; PEG, polyethylene glycol; Lipo, Lipofectamine; PEI, polyethylenimine; pRFP, plasmid red fluorescence protein; pLuci, plasmid luciferase; Gd-DTPA, gadopentetate dimeglumine; DP, DTPA-DGL-PEG; DPT, DTPA-DGL-PEG-TAT; pro, protein.
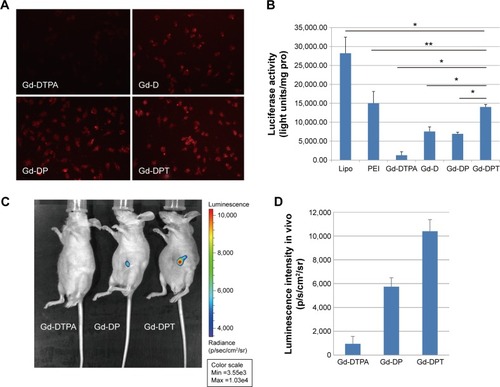
Figure 4 Magnetic resonance real-time tracking of the spread of the gene vector in vivo. Before and after injection locally, diffusion of Gd-DTPA/pRFP (Gd-DTPA), Gd-DP/pRFP (Gd-DP), and Gd-DPT/pRFP (Gd-DPT) in the tumor were monitored by T1 weighted imaging (white arrows). For Gd-DTPA, spread in tumor tissue was limited and washout was rapid; for Gd-DP, spread was limited but washout was difficult; and for Gd-DPT, the spread was homogeneous and washout was slow. The tumors are outlined with yellow dot lines on images.
Abbreviations: Gd, gadolinium; pRFP, plasmid red fluorescence protein; DGL, dendrigraft poly-L-lysine; PEG, polyethylene glycol; Gd-DTPA, gadopentetate dimeglumine; DP, DTPA-DGL-PEG; DPT, DTPA-DGL-PEG-TAT.
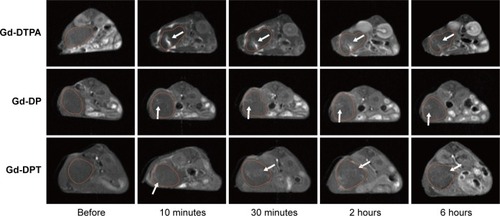
Figure 5 Quantitative imaging analysis.
Notes: T1 relaxation time at the center and rim of the tumors was calculated based on T1 software mapping before and after injection of Gd-DTPA/pRFP (A), Gd-DP/pRFP (B), and Gd-DPT/pRFP (C). To reflect the spread patterns after intratumoral injection, the concept of diffusion breadth was defined as the short axis diameter of the enhanced area in the tumor parenchyma. The ratios of diffusion breadths between successive time points were calculated for each group (D).
Abbreviations: Gd, gadolinium; pRFP, plasmid red fluorescence protein; DGL, dendrigraft poly-L-lysine; PEG, polyethylene glycol; DTPA, gadopentetate dimeglumine; DP, DTPA-DGL-PEG; DPT, DTPA-DGL-PEG-TAT; d, diffusion breadth.
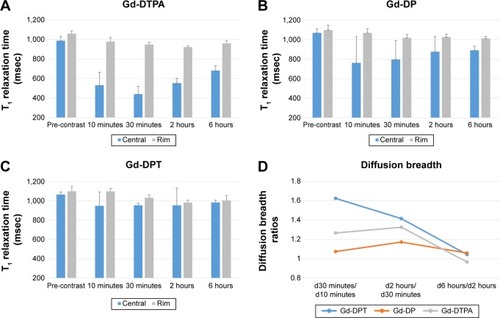
Figure 6 Confocal luminescence microscopy showing the in vivo distribution and amount of RFP expressed after transfection by naked plasmid or nanoparticles. Upper panel shows Gd-DTPA/pRFP (Gd-DTPA), middle panel shows Gd-DP/pRFP (Gd-DP), and lower panel shows Gd-DPT/pRFP (Gd-DPT). Red indicates RFP, blue indicates DAPI-stained cell nuclei, and yellow lines indicate crevices in tumor tissue. Original magnification 200×.
Abbreviations: Gd, gadolinium; DAPI, 4,6-diamidino-2-phenylindole; pRFP, plasmid red fluorescence protein; DGL, dendrigraft poly-L-lysine; PEG, polyethylene glycol; DTPA, gadopentetate dimeglumine; DP, DTPA-DGL-PEG; DPT, DTPA-DGL-PEG-TAT.
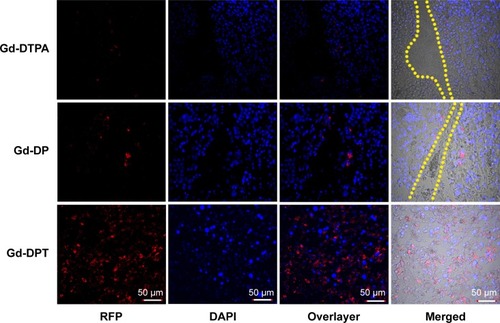
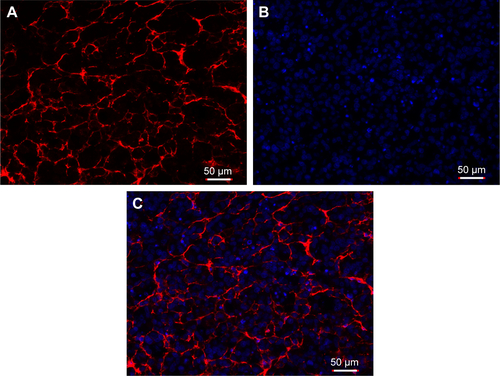
Figure S1 Histopathological study. The stromal response in this orthotopic nude mouse model of pancreatic ductal adenocarcinoma was detected by immunofluorescence of collagen type I, which is a major component of the extracellular matrix. A: Red indicates detected collagen type I; B: blue indicates DAPI stained cell nuclei; and C: the merged image of A and B. Original magnification 200×.
Abbreviation: DAPI, 4,6-diamidino-2-phenylindole.