Figures & data
Figure 1 1H-NMR spectra of mPEG-COOH (A) and mPEG-PEI (B).
Abbreviation: PEG-PEI, polyethylene glycol-polyethyleneimine.
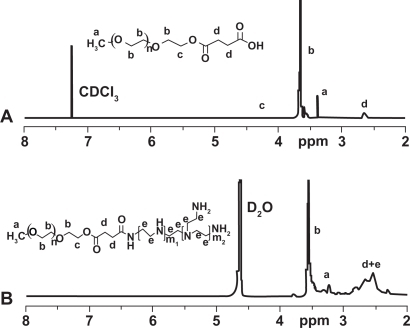
Figure 2 Size distribution of PEG-PEI nanoparticles at N/P 15 measured by Zeta Plus instrument.
Notes: The size distribution of two parts in the graph was respectively 180–242 nm, 845–1130 nm.
Abbreviation: PEG-PEI, polyethylene glycol-polyethyleneimine.
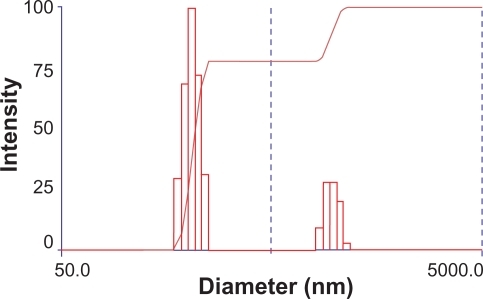
Table 1 The particle size and zeta potential of PEG-PEI/siRNA complexes
Figure 3 Scanning electron microscopy (SEM) images of PEG-PEI/siRNA nanoparticles at N/P 15 (120000× and 7500× respectively).
Abbreviations: PEG-PEI, polyethylene glycol-polyethyleneimine; N/P, charge ratio between amino groups of PEG-PEI and phosphate groups of siRNA.
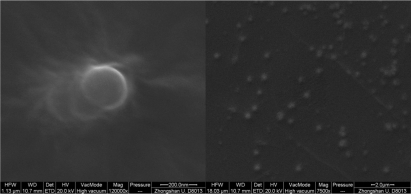
Figure 4 Gel electrophoresis of PEG-PEI/siRNA complexes at different N/P ratios.
Notes: Lane1: naked siRNA; Lane 2: PEG-PEI/siRNA at N/P 2.5; Lane 3: PEG-PEI/siRNA at N/P 5; Lane 4: PEG-PEI/siRNA at N/P 10; Lane 5: PEG-PEI/siRNA at N/P 15; Lane 6: PEG-PEI/siRNA at N/P 30.
Abbreviations: PEG-PEI, polyethylene glycol-polyethyleneimine; N/P, charge ratio between amino groups of PEG-PEI and phosphate groups of siRNA.
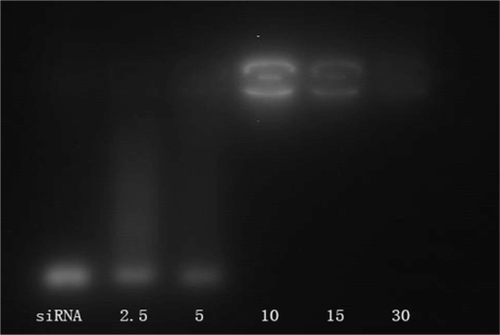
Figure 5a Cytotoxicity induced by the polymers of a variety of concentrations in SGC7901 cells (mean ± SD, n = 3, P < 0.05).
Abbreviations: PEG, polyethylene glycol; PEI, polyethyleneimine.
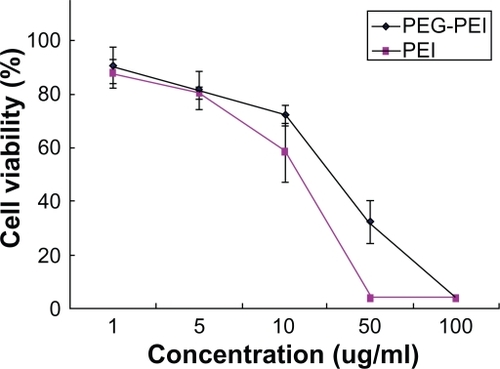
Figure 5b Cytotoxicity induced by PEG-PEI/siRNA complexes at different N/P ratios, PEI/siRNA and lipo2000/siRNA complexes after transfection into SGC7901 cells (mean ± SD, n = 3).
Abbreviations: PEG-PEI, polyethylene glycol-polyethyleneimine; N/P, charge ratio between amino groups of PEG-PEI and phosphate groups of siRNA.
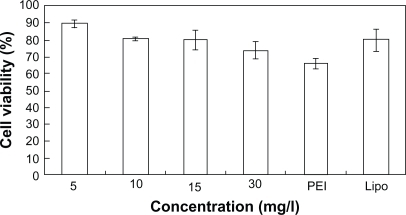
Figure 6a Fluorescence microscope images of SGC-7901 cells transfected with PEG-PEI/siRNA complexes at N/P = 5, 10, 15, 30, PEI (25 KD) and Lipo2000, respectively.
Abbreviations: PEG-PEI, polyethylene glycol-polyethyleneimine; N/P, charge ratio between amino groups of PEG-PEI and phosphate groups of siRNA.
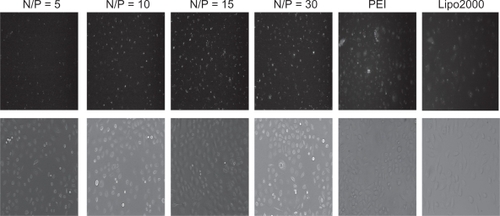
Figure 6b The transfection efficiencies of PEG-PEI/siRNA at different N/P ratios (N/P = 5, 10, 15, 30), lipo2000 and PEI (25 KD) measured by flow cytometry (mean ± SD, n = 3).
Abbreviations: PEG-PEI, polyethylene glycol-polyethyleneimine; N/P, charge ratio between amino groups of PEG-PEI and phosphate groups of siRNA; SD, standard deviation.
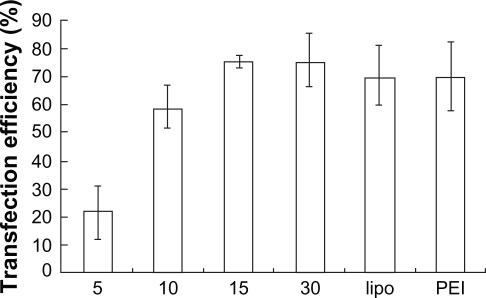
Figure 7 The result of RT-PCR analysis after transfection with PEG-PEI/siRNA.
Notes: M: marker. From the bottom: 100 bp, 200 bp, 300 bp, 400 bp, 500 bp, 700 bp, 1000 bp. Lane 1: siRNA-CD44v6/PEG-PEI complexes group. Lane 2: negative control siRNA/PEG-PEI complexes group. Lane 3: no treatment group. Lane 4: negative control group without RNA template. GADPH was used as a control.
Abbreviations: PEG-PEI, polyethylene glycol-polyethyleneimine; N/P, charge ratio between amino groups of PEG-PEI and phosphate groups of siRNA; GADPH, glyceraldehyde 3-phosphate dehydrogenase.
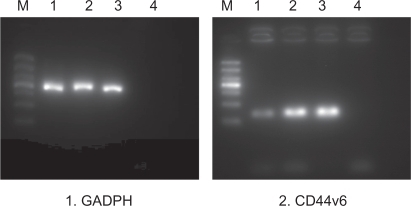
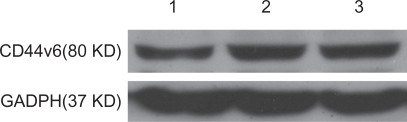
Figure 8 The result of Western blot analysis after transfection with PEG-PEI/siRNA.
Notes: Lane 1: siRNA-CD44v6/PEG-PEI complexes group. Lane 2: negative control siRNA/PEG-PEI complexes group. Lane 3: no treatment group.
Abbreviations: PEG-PEI, polyethylene glycol-polyethyleneimine; GADPH, glyceraldehyde 3-phosphate dehydrogenase.