
Figures & data
Table 1 Antimicrobial susceptibility of Pseudomonas aeruginosa
Figure 1 Time-dependent effect of AgCNTs on the growth of the mucoid (A) and nonmucoid (B) strains of Pseudomonas aeruginosa.
Note: The assay was conducted by incubating an initial inoculum of approximately 105 CFU/mL of either strain into Costar untreated polystyrene 96-well plates with AgCNTs at their respective MICs, two dilutions above the MIC (2× and 4× MIC), and one dilution below (0.5× MIC) in CA-MHB. Viable cell counts were determined after 2, 4, 8, and 24 hours of incubation at 37°C by plating serially diluted samples on Luria agar.
Abbreviations: AgCNTs, silver-coated carbon nanotubes; MIC, minimum inhibitory concentration; CA-MHB, cation-adjusted Müller–Hinton broth.
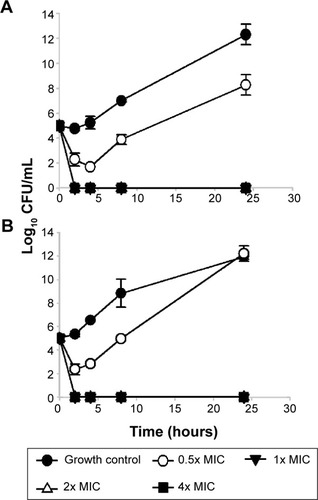
Figure 2 SEM images of mucoid and nonmucoid Pseudomonas aeruginosa.
Notes: Exponential phase bacteria were treated with 4× MIC of AgCNTs for 4 hours at 37°C and centrifuged at 2,000× g for 10 minutes. The pellets were then washed in 0.1% PBS and fixed overnight in a mix of 2.5% glutaraldehyde and 1% formaldehyde in 0.1% PBS. Samples were treated with 1% osmium tetroxide in 0.1% PBS, before stepwise dehydration in increasing concentrations of ethanol in water. The dehydrated samples (5 µL each) were then placed on SEM stubs and air-dried and sputter-coated with gold in a sputter-coat device prior to performing SEM analysis. (A) and (D) show images of untreated mucoid and nonmucoid cells, respectively. Bacterial cells have intact cell membranes with uniform shape. (B) and (C) show disintegrated and irregularly shaped mucoid cells, and (E) and (F) show AgCNT-treated nonmucoid bacterial cells. Treated samples show cell disintegration (red and blue arrows), dents or kinks on cell membranes (orange arrow), and broken cells (green arrow).
Abbreviations: AgCNTs, silver-coated carbon nanotubes; MIC, minimum inhibitory concentration; PBS, phosphate-buffered saline; SEM, scanning electron microscopy.
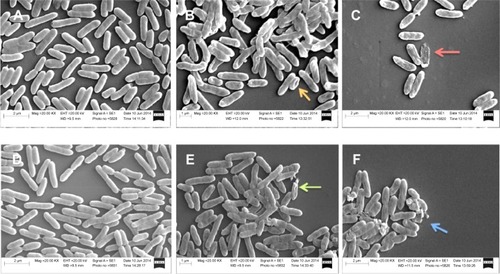
Figure 3 TEM of mucoid and nonmucoid strains of Pseudomonas aeruginosa.
Notes: Exponential phase bacteria were treated with 4× MIC of AgCNTs for 4 hours at 37°C, and centrifuged at 2000× g for 10 minutes. The pellets were then washed in 0.1% PBS and fixed overnight in a mix of 2.5% glutaraldehyde and 1% formaldehyde in 0.1% PBS. Samples were treated with 1% osmium tetroxide in 0.1% PBS, before stepwise dehydration in increasing concentrations of ethanol in water. After dehydration, the samples were passed through propylene oxide and infiltrated with Embed 812 resin and polymerized overnight. Ultrathin sections were collected on copper grids stained with 2% uranyl acetate and lead citrate and imaged using the TEM. (A) and (D) show images of untreated mucoid and nonmucoid cells, respectively, with intact cell membranes. (B) and (C) show AgCNT-treated mucoid cells with efflux of cellular material and empty ghost cells (orange and purple arrows), whereas (E) and (F) show cells with intracellular material completely disintegrated (black and red arrow) and the absence of cell membranes.
Abbreviations: AgCNTs, silver-coated carbon nanotubes; MIC, minimum inhibitory concentration; SEM, scanning electron microscopy; TEM, transmission electron microscopy.
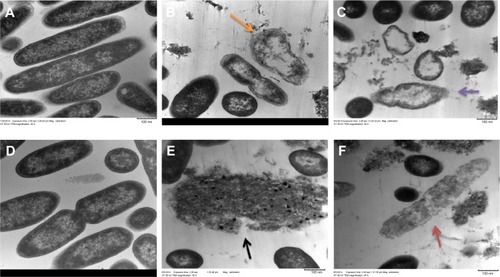
Table 2 Genes, gene product, and product function
Figure 4 Relative gene-expression levels of AgCNT-treated Pseudomonas aeruginosa.
Notes: *P,0.05; **P,0.01; ***P,0.001. Untreated and either AgCNT- or gentamicin-treated exponential phase bacteria were exposed to 4× MIC for 4 hours at 37°C. Total RNA was purified using an RNeasy Mini kit and quantified. cDNA synthesis was carried out in 20 µL reaction volumes using the Applied Biosystems High-Capacity cDNA Reverse Transcriptase Kit. A total of 1 µg of RNA was used to amplify the virulence genes of P. aeruginosa using the Applied Biosystems ViiA 7 real-time PCR system. The amplification conditions used were one cycle of initial denaturation at 95°C for 2 minutes, followed by 40 cycles of 95°C for 15 seconds, 56°C for 25 seconds, and 72°C for 30 seconds. The relative changes in gene expression were calculated using the expression 2−ΔΔCT, where all values were normalized with respect to the 16S mRNA levels. (A) and (C) are AgCNTs- and gentamicin-treated mucoid P. aeruginosa, respectively; (B) and (D) are AgCNTs- and gentamicin-treated nonmucoid P. aeruginosa, respectively.
Abbreviations: AgCNTs, silver-coated carbon nanotubes; MIC, minimum inhibitory concentration; cDNA, complementary DNA; PCR, polymerase chain reaction; CT, cycle threshold; mRNA, messenger RNA.
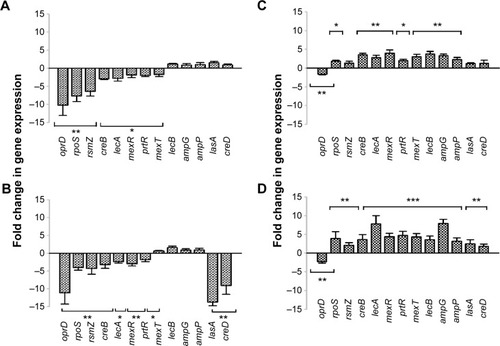
Table S1 Gene and primers used for quantitative reverse-transcriptase polymerase chain reaction (sequence 5′ → 3′)