Figures & data
Table 1 Experimental design for the study and detailed description of different groups
Figure 1 Inhibitory potential of bLf in in vitro cell culture model.
Notes: (A) Giemsa stain smear showing infected macrophages with intracellular parasites post 12 and 24 hours treatment with 20 μg/mL concentration of various Lf forms as well as sulphadiazine. Red arrows represents the multiplying tachyzoites. (B) Mean number of infected macrophages post 24 hours treatment and mean number of intracellular tachyzoites present inside the macrophages post 24 hours. (C) NO production in different groups after treatment with various drugs at 24 hours posttreatment. Significant difference found in NO production between untreated and all treated groups except bLf Fe and between sulphadiazine and bLf Fe (P<0.001). Significant difference was found between the untreated group and treated groups in mean number of macrophages as well as tachyzoites, (P<0.05). Results were obtained from three experiments, which were repeated twice with similar observations and presented in the ± SD or SEM. Results were analyzed with Student’s t-test. Significant difference represented by asterisk *P<0.05, ***P<0.01.
Abbreviations: SEM, standard error of the mean; bLf, bovine lactoferrin; NO, nitric oxide.
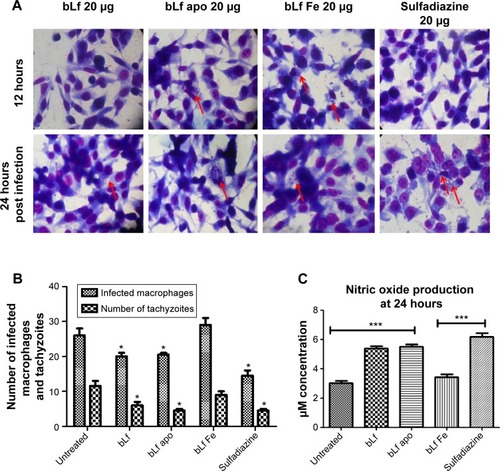
Figure 2 Histpathological analysis in liver and spleen at day 10 and 15 post infection.
Notes: (Ai) Liver histopathology of untreated group of mice at day 10 postinfection showing the presence of tachyzoites (marked with red arrows). (Aii–iv) Liver histopathology of treatment groups showing no sign of inflammation or parasite at day 10 post infection. (Av) Untreated control group showing huge number of infected macrophages marked by red arrows. (Avi–vii) bLf and NCs treatment groups showing development of bradyzoites or tissue cyst inside the macrophages (kupffer cells) marked by red arrows. (Aviii) Sulphadiazine treatment group showing no infection but sign of inflammation marked by red arrow. Figure B. (Bi) Untreated Liver cells showing multiple sites of tachyzite multiplication (red arrows). (Bii–iv). Treatment groups showing no sign of inflammation or infection. (Bv) Liver histopathology at day 15 post infection showing multiple sites (50%) with tachyzoites marked with red arrows. (Bvi–vii) No parasite infection shown in treatment groups, however, inflammation was seen in sulphadiazine group (Bviii) marked as red arrow.
Abbreviations: AEC-CCo-CP-bLf, alginate chitosan calcium phosphate bovine lactoferrin; bLf, bovine lactoferrin; NO, nitric oxide.
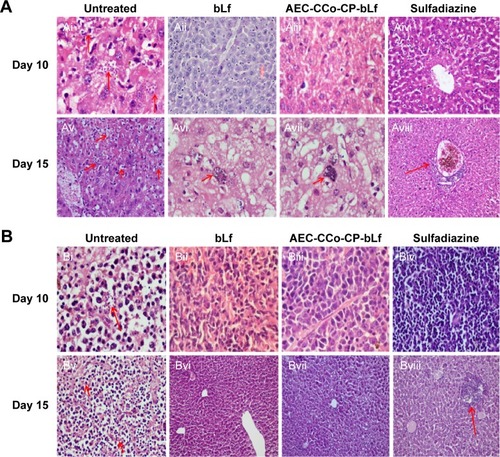
Figure 3 Box plot showing parasite load in different groups of mice.
Notes: Results were obtained from triplicate experiments with similar observations and presented in the ± SD or SEM and analyzed with Student’s t-test. Significant difference represented by *P<0.05, **P<0.005.
Abbreviations: AEC-CCo-CP-bLf, alginate chitosan calcium phosphate bovine lactoferrin; bLf, bovine lactoferrin; SEM, standard error of the mean.
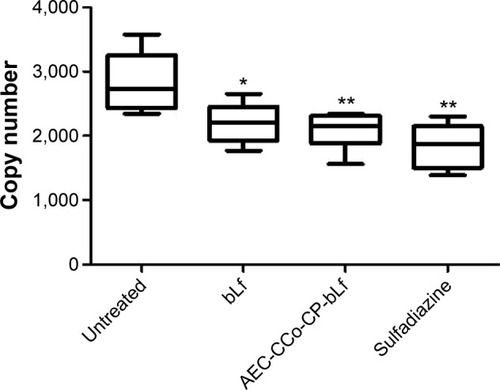
Figure 4 ROS and NO production.
Notes: (A) ROS production in liver cells of various groups of mice posttreatment at day 15 postinfection. Overlay of various MFI showing the comparison with untreated group. (B) ROS production in spleen cells showing an increase in MFI in all treated groups compared with untreated group. (C) NO production in different groups of mice at days 10 and 15 postinfection showing efficacy of killing effect of nanocapsules and bLf. Experiment was repeated twice, which included five mice in each group. Results were obtained from triplicate observations and presented in the ± SD or SEM. Results were analyzed with Student’s t-test. Significant difference represented by **P<0.01, *P<0.05.
Abbreviations: AEC-CCo-CP-bLf, alginate chitosan calcium phosphate bovine lactoferrin; bLf, bovine lactoferrin; MFI, mean fluorescence intensity; NO, nitric oxide; ROS, reactive oxygen species; SEM, standard error of the mean.
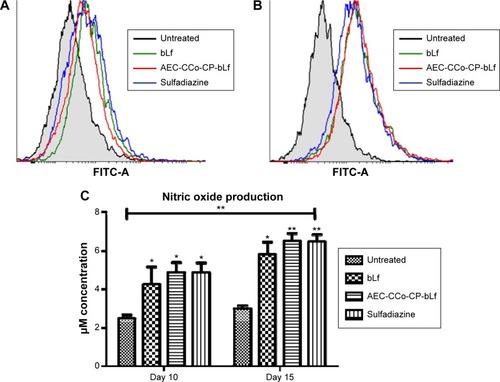
Table 2 Cytokines levels (pg/mL) for cytokines of innate immunity, adaptive immunity and cytokines of Th17 differentiation and activation of immune cells for immune responses and inflammation
Figure 5 Iron metabolism and bio distribution of bLf.
Notes: (A) The miRNA expression of different iron metabolism miRNAs, such as miR-Let7d, miR-122, miR-196, miR-200b, miR-210, miR-214, miR-320, miR-485, and miR-584, was identified in different tissues of control and nanoformulated diet-fed mice. (B) When the concentration of AEC-CCo-CP-bLf-NCs in the tissue lysates was studied in the infected tissues of mice after 15 days of treatment with this drug as compared with bLf alone, nanoformulated Lf was predominantly observed in the tissues, mainly the vital tissues of bacterial colonization (ie, small intestine, blood and liver, among others). Results are expressed as mean ± SD and P.0.05 is found to be statistically different.
Abbreviations: AEC-CCo-CP-bLf-NCs, alginate chitosan calcium phosphate bovine lactoferrin nanocapsules; bLf, bovine lactoferrin; Lf, lactoferrin.
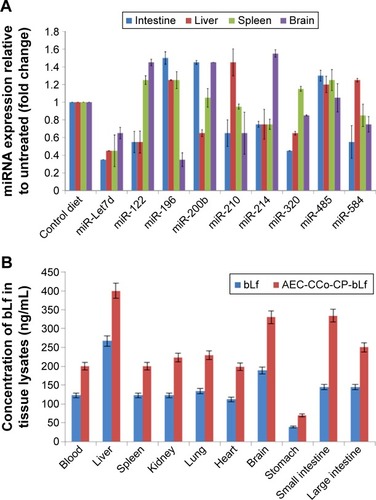
Figure 6 Immunoreactivity in different organs.
Notes: (A) Immunoreactivity with liver cells: (Ai) Liver cells of mice fed with normal diet showing negative IHC. (Aii and Aiii) Lf-treated mice showing positive IHC in liver Kupffer cells and negative in hepatocytes when observed at ×20 and ×40. (B) Immunoreactivity with spleen cells: (Bi) Spleen cells of mice which were fed with normal diet showing negative IHC. (Bii) Lf-treated mice showing positive IHC (brown color using DAB) in spleen macrophages cells ×20. (Biii) Positive IHC of spleen cells ×40.
Abbreviations: AEC-CCo-CP-bLf, alginate chitosan calcium phosphate bovine lactoferrin; bLf, bovine lactoferrin; DAB, diaminobenzidine; IHC, immunohistochemistry; Lf, Lactoferrin.
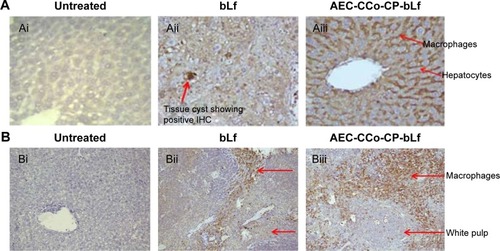
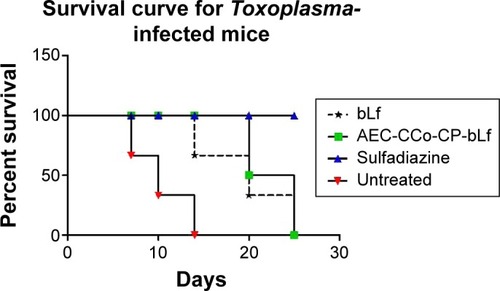
Figure 7 Survival curve for Toxoplasma-infected mice showing mortality in different groups of mice.
Abbreviations: AEC-CCo-CP-bLf, alginate chitosan calcium phosphate bovine lactoferrin; bLf, bovine lactoferrin.