Figures & data
Figure 1 Concept of fiber-optic triggered photo-thermal responsive liposomes release in vivo.
Notes: (A) Application in anticancer treatment with intratumoral (AuNP embedded) liposome delivery and optical fiber guided laser excitation. Fluorescein was encapsulated in liposome for simulating the drug content release profiles. (B) Xenograft mice model experiment with fiber-optic conveyed laser excitation inside isoflurane chamber. (C) A computed tomography (fluoroscopy) guided needle insertion (similar or smaller needle size to percutaneous biopsy of thoracic spine tumor as figure shown) could be applied to place the device’s fiber bundle probe to reach deeper tumor.
Abbreviation: AuNP, gold nanoparticle.
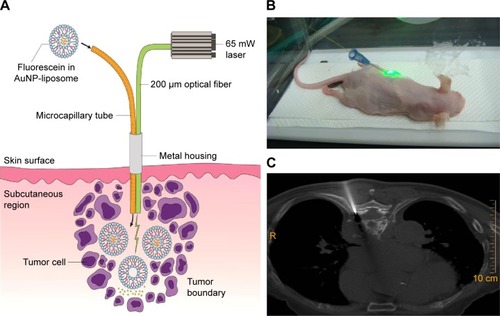
Figure 2 Quantification of liposomes release by mitigation of fluorescein self-quench.
Notes: Fluorescein solution in self-quench concentration (75 mM) was encapsulated in liposome. After fiber-optic triggered photo-thermal responsive release, discharged fluorescein from liposome was diluted and emitted brighter fluorescence.
Abbreviation: TOP, tri-n-octylphosphine.
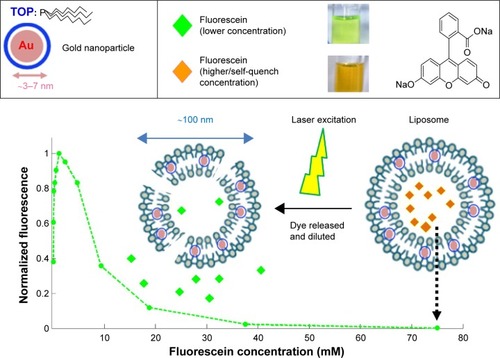
Figure 3 Photo-thermal energy conversion by AuNPs in chloroform.
Notes: (A) Illustration of apparatus. (B) Appearance of collimated laser beam exiting optical fiber and illuminating into dark-reddish AuNP solution in chloroform. (C) AuNPs concentration and excitation duration dependent photo-thermal conversion profiles with fixed light path (h=2 cm). Data of (C) represent mean ± standard deviation (n=3).
Abbreviation: AuNP, gold nanoparticle.
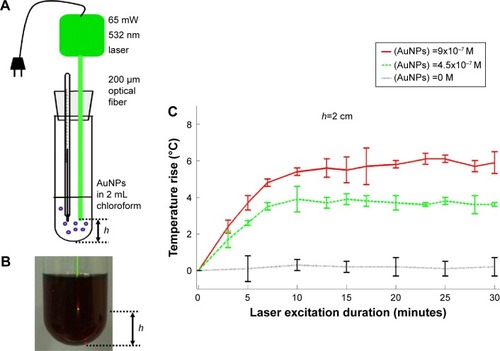
Figure 4 Fiber-optic guided laser excitation triggered photo-thermal responsive liposomes release in vitro.
Notes: (A) Illustration of apparatus. (B) Appearance of AuNP-liposome observed by transmission electron microscopy. (C) Particle size distribution of AuNP-liposome detected by dynamic laser scattering. (D) Contribution of AuNPs in photo-thermal responsive release of liposome. Data of (D) represent mean ± standard deviation (n=3).
Abbreviations: AuNP, gold nanoparticle; DPPC, 1,2-dipalmitoyl-sn-glycero-3-phosphatidylcholine; DSPC, 1,2-distearoyl-sn-glycero-3-phosphatidylcholine; DSPE-PEG2k, 1,2-distearoyl-sn-glycero-3-phosphoethanolamine-N-[methoxy (polyethylene glycol)-2000].
![Figure 4 Fiber-optic guided laser excitation triggered photo-thermal responsive liposomes release in vitro.Notes: (A) Illustration of apparatus. (B) Appearance of AuNP-liposome observed by transmission electron microscopy. (C) Particle size distribution of AuNP-liposome detected by dynamic laser scattering. (D) Contribution of AuNPs in photo-thermal responsive release of liposome. Data of (D) represent mean ± standard deviation (n=3).Abbreviations: AuNP, gold nanoparticle; DPPC, 1,2-dipalmitoyl-sn-glycero-3-phosphatidylcholine; DSPC, 1,2-distearoyl-sn-glycero-3-phosphatidylcholine; DSPE-PEG2k, 1,2-distearoyl-sn-glycero-3-phosphoethanolamine-N-[methoxy (polyethylene glycol)-2000].](/cms/asset/df91c326-17da-4546-ad12-8979509ea73f/dijn_a_85915_f0004_c.jpg)
Figure 5 Characterization of synthesized gold nanoparticles.
Notes: (A) Morphology observed by transmission electron microscopy (black bar =10 nm). (B) Particle size distribution detected by dynamic laser scattering. (C) Surface plasma resonance band identified by absorbance spectrum with a maximal absorbance at approximately 522 nm. (D) Face-centered crystal lattice indicated by X-ray diffraction spectrum.
Abbreviation: au, arbitrary unit.
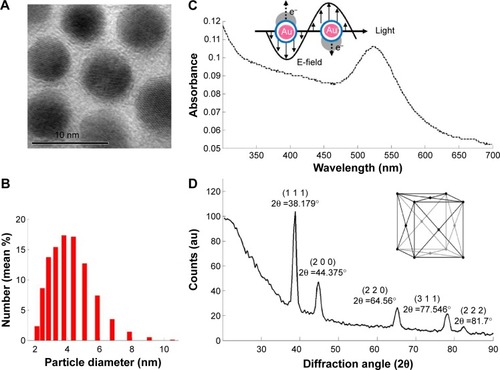
Figure 6 Optimal composition of photo-thermal liposome.
Notes: (A) Effect of AuNP concentration. DPPC:MPPC:DSPE-PEG2k (90:10:4) liposome with 33 ng/mL AuNP had photo-thermal conversion efficiency and stability among AuNP concentrations from 16 ng/mL to 66 ng/mL. (B) Effect of phospholipid compositions. Both DSPC:DPPC (90:10) and DPPC:Chol (80:20) liposomes had insufficient photo-thermal conversion efficiency and stability.
Abbreviations: AuNP, gold nanoparticle; Chol, cholesterol; DPPC, 1,2-dipalmitoyl-sn-glycero-3-phosphatidylcholine; DSPC, 1,2-distearoyl-sn-glycero-3-phosphatidylcholine; DSPE-PEG2k, 1,2-distearoyl-sn-glycero-3-phosphoethanolamine-N-[methoxy (polyethylene glycol)-2000]; MPPC, 1-myristoyl-2-palmitoyl-sn-glycero-3-phosphotydilcholine.
![Figure 6 Optimal composition of photo-thermal liposome.Notes: (A) Effect of AuNP concentration. DPPC:MPPC:DSPE-PEG2k (90:10:4) liposome with 33 ng/mL AuNP had photo-thermal conversion efficiency and stability among AuNP concentrations from 16 ng/mL to 66 ng/mL. (B) Effect of phospholipid compositions. Both DSPC:DPPC (90:10) and DPPC:Chol (80:20) liposomes had insufficient photo-thermal conversion efficiency and stability.Abbreviations: AuNP, gold nanoparticle; Chol, cholesterol; DPPC, 1,2-dipalmitoyl-sn-glycero-3-phosphatidylcholine; DSPC, 1,2-distearoyl-sn-glycero-3-phosphatidylcholine; DSPE-PEG2k, 1,2-distearoyl-sn-glycero-3-phosphoethanolamine-N-[methoxy (polyethylene glycol)-2000]; MPPC, 1-myristoyl-2-palmitoyl-sn-glycero-3-phosphotydilcholine.](/cms/asset/c2d0fedc-93ea-4e8b-ab64-87093e9c9259/dijn_a_85915_f0006_c.jpg)
Figure 7 Effect of liposome encapsulation on diffusion of fluorophores in tumor.
Notes: (A) Diffusion profile of 1 mM free fluorescein in tumor. (B) Diffusion profile of 1 mM fluorescein encapsulated liposome in tumor. (C) Quantification of diffusion profiles. The positions of tumors in (A) and (B) are indicated by the white arrowhead in the bright-field (BF) images. Data of (C) represent mean ± standard deviation (n=5).
Abbreviation: AuNP, gold nanoparticle.
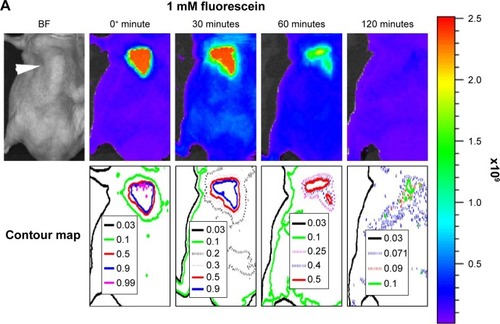
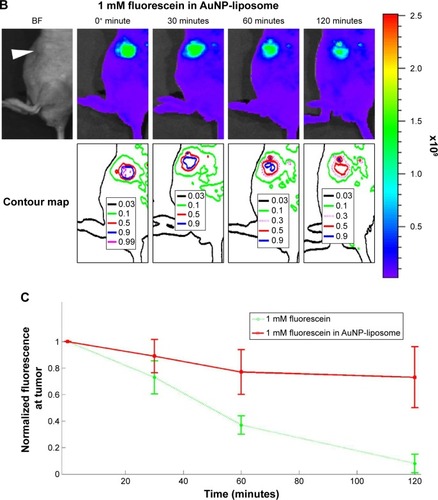
Figure 8 Fiber-optic guided laser excitation triggered photo-thermal responsive liposomes release in vivo.
Notes: (A) Releasing profile of 75 mM fluorescein (in self-quench concentration) encapsulated in liposome with excitation. (B) Quantification of releasing profiles with or without excitation. The position of tumor in (A) is indicated by the white arrowhead in the bright-field (BF) images. Data of (B) represent mean ± standard deviation (n=5).
Abbreviation: AuNP, gold nanoparticle.
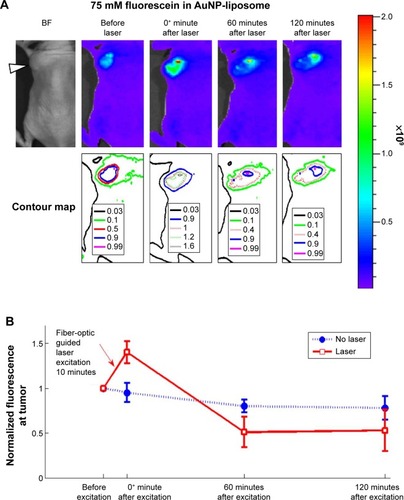
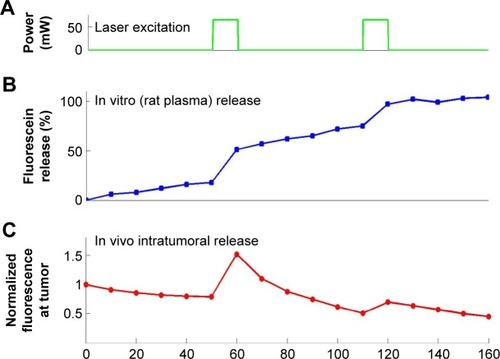
Figure 9 Profile of triggered liposome release under consecutive pulsatile excitation.
Notes: (A) Laser excitation durations. (B) Consecutive release in vitro (rat plasma). (C) Consecutive release in vivo (mice xenograft).