Figures & data
Figure 1 Schematic diagrams of cisplatin (CDDP), the dendrimers G1, G2 and their possible reactions (generation of different conjugates) in aqueous media.
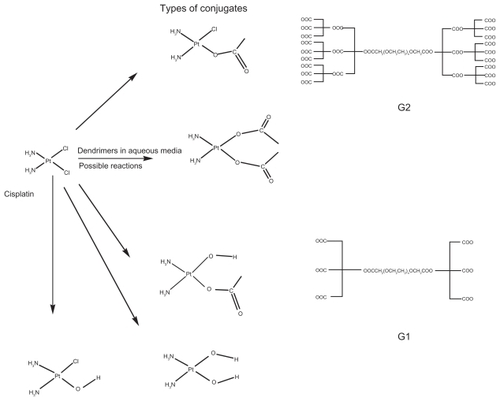
Figure 2 The comparative release of chloride ions from cisplatin (CDDP) alone and in reaction with the dendrimers G1 and G2.
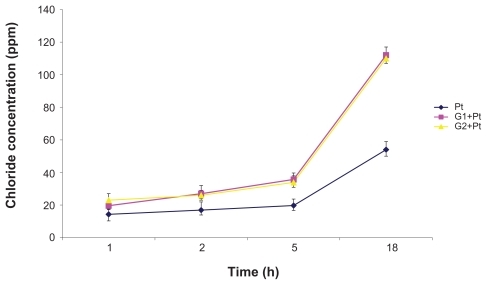
Table 1 The weight percent of platinum in the conjugates at different ratios of the dendrimers to cisplatin
Figure 3 In vitro release of platinum from the G1+Pt and G2+Pt conjugates at two different pHs.
Abbreviation: h, hours.
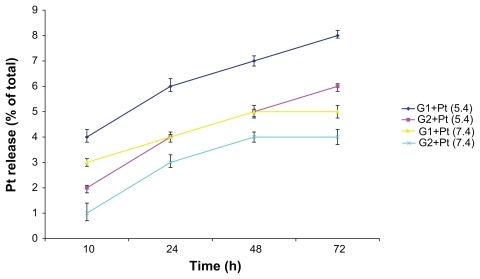
Table 2 Size and zeta potential distributions of the dendrimers and their related conjugates after reaction with cisplatin (CDDP)
Figure 4 FT-IR spectra of the dendrimers before and after the reaction with cisplatin (CDDP). IR: (A) G1, (B) G1+Pt, (C) G2, (D) G2+Pt.
Abbreviations: FTIR, Fourier transform infrared; IR, infra-red.
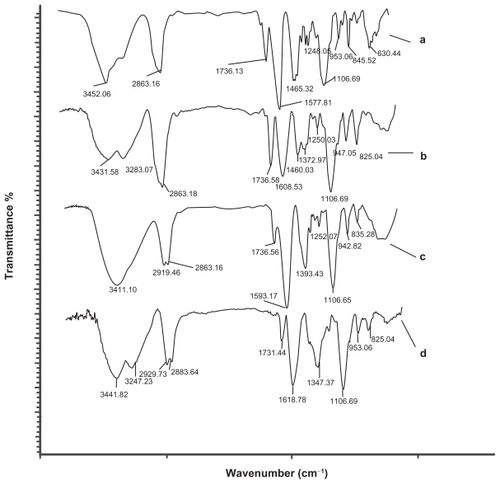
Figure 5 Viability of the different cancer cell lines according to the mitochondrial activity of the cells incubating with different kinds of Pt derivatives and free cisplatin (CDDP) after 24 and 48 hrs. (A) HT1080 cell line, (B) CT26 cell line, (c) SKOV3.
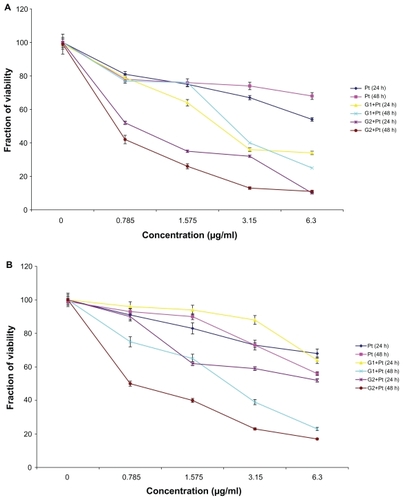
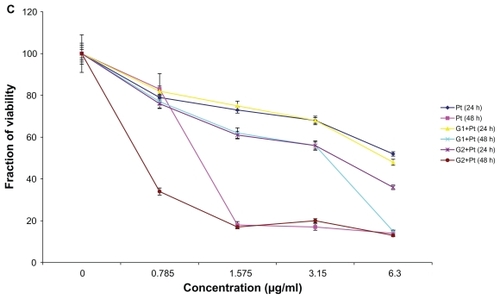
Figure 6 The IC50 of some of the conjugates and free cisplatin (CDDP) in different cancer cell lines at different times.
Abbreviation: h, hours.
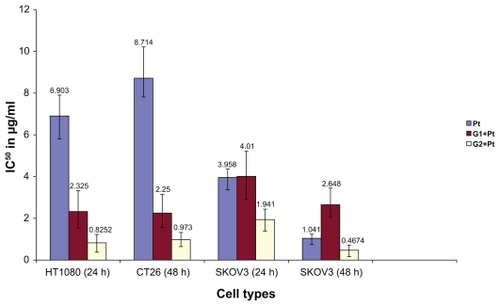
Figure 7 In vitro release of hemoglobin from human erythrocytes in contact with various concentrations of free cisplatin (CDDP) and Pt derivatives after 2 hrs of incubation.
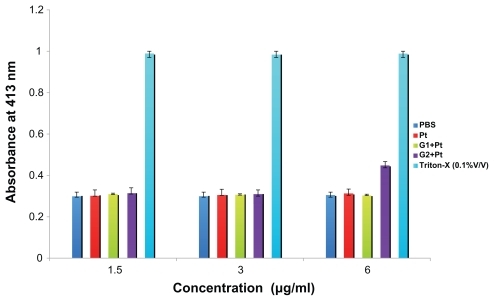
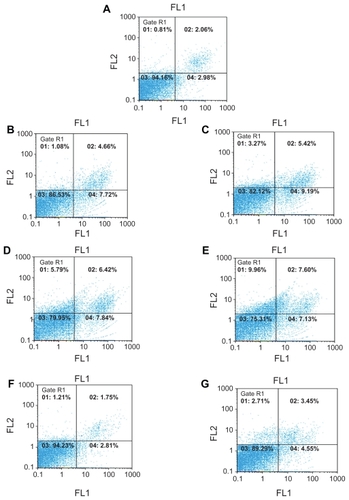
Figure 8 Dot plot diagrams related to the amount of apoptosis-necrosis assays. Impact of the conjugates and free cisplatin (CDDP) at two concentrations on the percentage of apoptosis and necrosis. The data were analyzed with a version 2.4 of Flomax software. (A) negative control, (B) G1(0.75 μg/ml), (C) G1(1.5 μg/ml), (D) G2 (0.75 μg/ml), (E) G2 (1.5 μg/ml). (F) Platinum (0.75 μg/ml), (G) Platinum (1.5 μg/ml). Lower right: apoptotic cells, Upper right: necrotic and secondary apoptotic cells, Lower left: viable cells, Upper left: damaged cells.