Figures & data
Table 1 Composition of protocol media to recover emulsion-dispersed particles
Figure 1 Influence of ultrasonication time on emulsion size distribution.
Notes: Empty circles: without sonication. After 15 minutes (full squares) and 30 minutes (full triangles) of ultrasonication exposure.
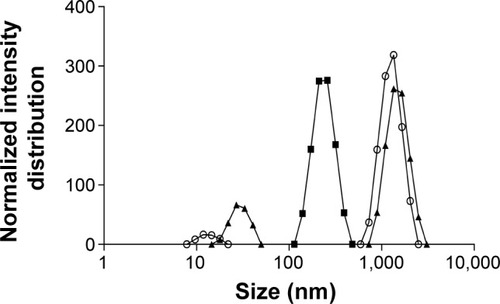
Figure 2 Influence of cosurfactant addition on emulsion size distribution.
Notes: After 10 minutes (empty squares), 15 minutes (full diamonds), 20 minutes (full triangles), 25 minutes (empty circles), and 30 minutes (empty triangles) of ultrasonication exposure.
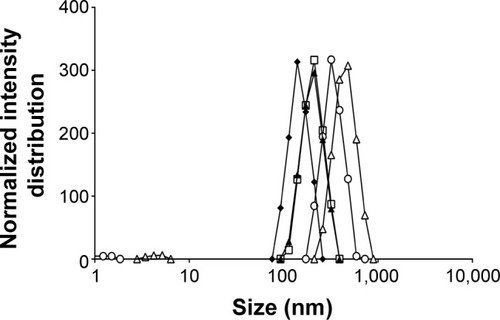
Figure 3 Influence of protocol extractions (A–F) on insulin-based particles recovery yield from the oil phase.
Note: Each value represents mean ± standard deviation, n=3.
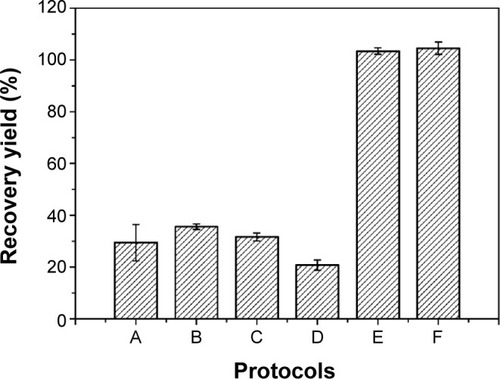
Table 2 Granulometric distribution of particles
Figure 4 Size distribution of particles under the following processing steps.
Notes: Full circles: single surfactant-assisted particles. Empty circles: cosurfactant and ultrasonication-assisted particles. Full squares: after 5 minutes of ultrasonication exposure. Empty squares: after 10 minutes of ultrasonication exposure.
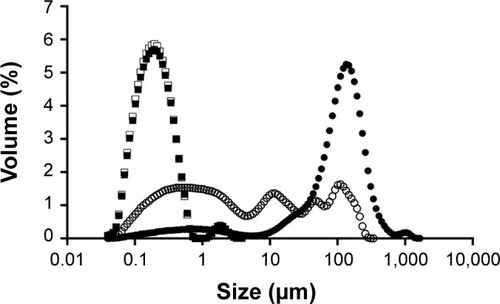
Table 3 Zeta potential (mean ± standard deviation, n=3) of nanoparticles after each processing step at different pHs
Figure 5 SEM microphotograph.
Notes: (A) Scale bar =20 μm; single surfactant-assisted particles. (B) Scale bar =1 μm; cryo-SEM microphotographs of cosurfactant and ultrasonication-assisted particles.
Abbreviation: SEM, scanning electron microscopy.
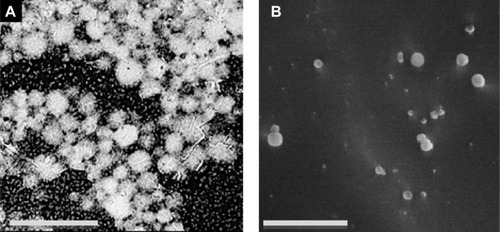
Figure 6 Insulin release profile simulated in pH 1.2 gastric fluid for 2 hours followed by 4 hours in pH 6.8 intestinal fluid at 37°C.
Note: Each value represents mean ± standard deviation, n=3.
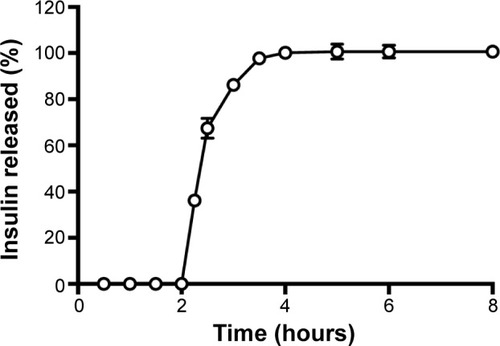
Table 4 Theoretical studies of HOMO-LUMO gap and dipole moment of anionic polymers
Figure 7 Predicted interaction between biopolymers based on distribution of frontier molecular orbitals (HOMO and LUMO).
Notes: (A) HOMO-LUMO gap and (B) interaction between alginate (I) and dextran sulfate (II) based on their distribution coefficients of HOMO and LUMO, respectively. The positive and negative regions are represented by blue and red colors, respectively.
Abbreviations: HOMO, highest occupied molecular orbital; LUMO, lowest unoccupied molecular orbital.
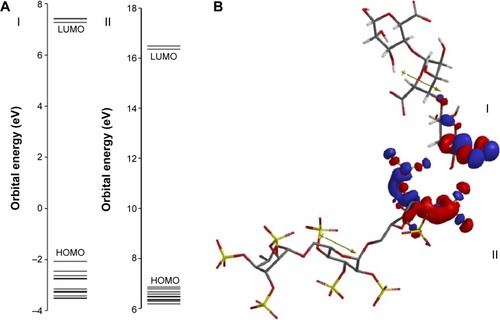
Table 5 Estimation results of the secondary structural content of insulin extracted from nanoparticles before and after recovery, rotoevaporation, and ultrasonication as obtained from circular dichroism spectral analyses
Figure 8 Circular dichroism spectra of insulin in phosphate-buffered saline at pH 7.4 and 25°C.
Notes: Solid black line: nonencapsulated insulin. Solid blue line: insulin released from nanoparticles after recovery. Solid red line: insulin released from nanoparticles after rotoevaporation. Solid grey line: insulin released from nanoparticles after ultrasonication exposure.
Abbreviation: θMRW, mean residue molar ellipticity.
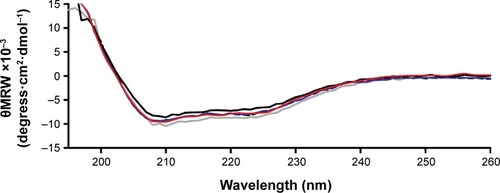
Figure 9 Fourier transform infrared spectra of insulin.
Notes: Fourier transform infrared spectra of nonencapsulated reference insulin in solution (solid black line), nonencapsulated insulin in solution after 10 minutes of ultrasonication exposure (dashed black line), insulin entrapped into nanoparticles (solid grey line), and insulin entrapped into nanoparticles after 10 minutes of ultrasonication exposure (dashed grey line).
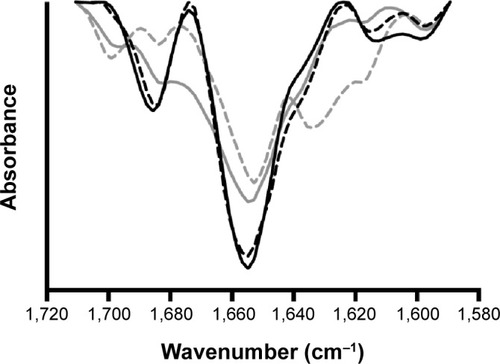
Figure 10 Blood glucose levels of diabetic Wistar rats after subcutaneous administration of insulin.
Notes: Full circles: nonencapsulated insulin. Empty diamonds: insulin released from nanoparticles. Comparison is made to extracted unloaded nanoparticles (empty circles). The formulations were administered in sodium citrate in phosphate-buffered pH 7.4 solution. Results are expressed as mean ± standard deviation, n=6 per group. Statistically different from empty nanoparticles: *P<0.5; **P<0.01.
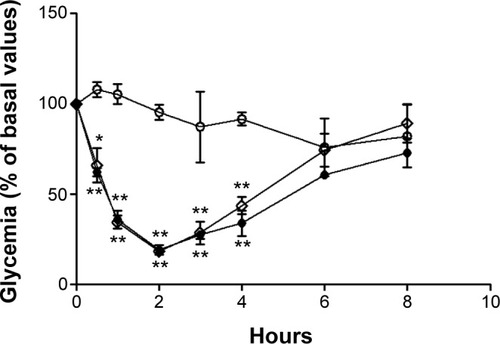
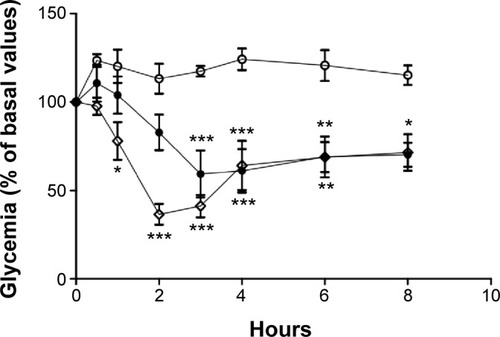
Figure 11 Blood glucose levels of diabetic Wistar rats after subcutaneous administration of 2 IU/kg of insulin in water.
Notes: Empty diamonds: nonencapsulated insulin. Full circles: insulin entrapped into nanoparticles. Comparison is made to unloaded nanoparticles (empty circles). The formulations were administered in water. Results are expressed as mean ± standard deviation, n=6 per group. Statistically different from empty nanoparticles: *P<0.05; **P<0.01; ***P<0.001.