Figures & data
Figure 1 Characterization of the synthesized multifunctional nanoparticles.
Notes: (A) Size dependence of nanoparticles synthesized with different ratios of PLGA and mPEG-DSPE (PLGA/DSPE). (B) Loading efficiency of Rhodamine 6G in the nanoparticles prepared by with PLGA/DSPE ratios. (C) Zeta potential of nanoparticles synthesized with different PLGA/DSPE ratios. (D) T1 relaxation time for four different sizes of nanoparticles at different concentrations. (E) Schematic diagram of the nanoparticle structure. (F–K) Scanning electron microscopy images of nanoparticles, the scale bars represent 200 nm. (L) TEM image showing the structure of the nanoparticles. (M) High magnification of the TEM image showing the nanoparticles with a denser PLGA inner core. (N) High magnification of the TEM image showing an empty nanoparticle fabricated without the addition of PLGA. (Error bars indicate the standard deviation and the number of samples used in each measurement, n=4).
Abbreviations: DSPE, distearoyl-sn-glycero-3-phosphoethanolamine-N; PLGA, poly lactic-co-glycolic acid; TEM, transmission electron microscopy; MCTS, multicellular tumor spheroids; h, hours.
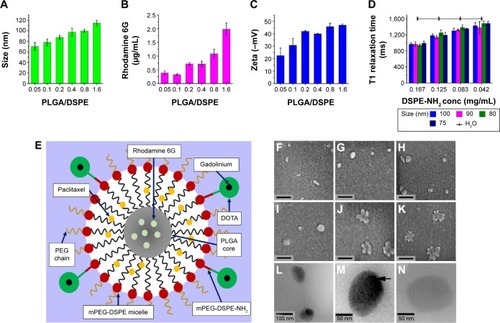
Figure 2 Uptake of different sizes of nanoparticles (65 nm, 85 nm, and 110 nm) in the MCTS of the PANC-1, MIA PaCa-2, or PC-3 cell lines.
Notes: (A) Normalized relative fluorescence intensity of the MCTS of the PANC-1 cell line at different time intervals. (B) Normalized relative fluorescence intensity of the MCTS of the MIA PaCa-2 cell line at different time intervals. (C) Normalized relative fluorescence intensity of the MCTS of the PC-3 cell line at different time intervals. For the MCTS of the PANC-1 cell line treated with 65 nm, 85 nm, and 110 nm nanoparticles at 1 hour, 6 hours, and 24 hours: (D–F) bright field images, (G–I) fluorescence images with the white arrow highlighting the uneven distribution of the nanoparticles, and (J–L) intensity maps showing the relative fluorescent intensity of different regions of the MCTS of PANC-1. For the MCTS of the MIA PaCa-2 cell line treated with 65 nm, 85 nm, and 110 nm nanoparticles at 1 hour, 6 hours, and 24 hours: (M–O) bright field images, (P–R) fluorescence images, and (S–U) intensity maps showing the relative fluorescent intensity of different regions of the MCTS of MIA PaCa-2. The scale bar represents 100 μm. Error bars indicate the standard deviation and the number of samples used in each measurement (n=4). *Indicates statistical difference (P<0.05) amongst the three mean fluorescent measurements at that time point, obtained from the testing of the three nanoparticle solutions based on the single variable analysis of variance test.
Abbreviations: MCTS, multicellular tumor spheroids; PLGA, poly lactic-co-glycolic acid; DSPE, distearoyl-sn-glycero-3-phosphoethanolamine-N; h, hours.
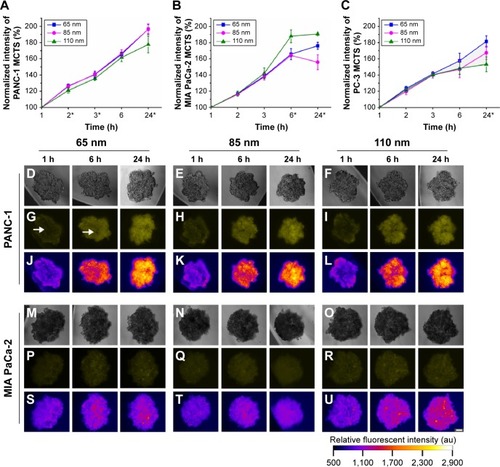
Figure 3 Flow cytometry was used to investigate the relationship between the size and therapeutic effect of the multifunctional nanoparticles in the MCTS of the MIA PaCa-2 cell line.
Notes: (A) The percentage of MIA PaCa-2 cells in apoptosis after 24 hours of treatment with nanoparticles of 65 nm, 85 nm, and 110 nm. (B) In vitro release studies of the anticancer drug Paclitaxel (PTX) and Rhodamine 6G (Rho 6G) from 65 nm, 85 nm, and 110 nm nanoparticle formulations. Dotted lines and solid lines indicate in vitro studies performed in PBS and FBS, respectively. Rhodamine 6G release was examined in both PBS and FBS, represented by the dashed lines. (C–F) Flow cytometry results showing the cell count (y-axis) and propidium iodide fluorescent intensity (x-axis) of cells from MIA PaCa-2. (Vertical lines indicate the standard deviation and the number of samples used in each measurement, n=4). *Indicates statistical difference (P<0.05) using single variable analysis of variance (ANOVA) between the three treated groups. #Indicates statistical difference (P<0.05) using single variable ANOVA between the Paclitaxel release from the different sizes of nanoparticles.
Abbreviations: MCTS, multicellular tumor spheroids; PBS, phosphate buffered saline; FBS, fetal bovine saline; PTX, Paclitaxel; h, hours; NP, nanoparticles.
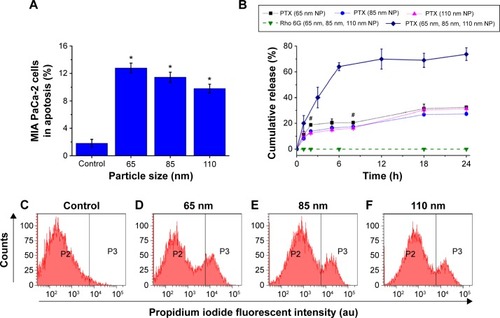
Figure 4 In vivo fluorescence and magnetic resonance imaging using the prepared multifunctional nanoparticles.
Notes: Fluorescence images taken for tumor-bearing mice treated with (A) 65 nm, 85 nm, and 110 nm nanoparticles after 1 hour, (B) 65 nm, 85 nm, and 110 nm nanoparticles after 3 hours, and (C) with 110 nm nanoparticles after 48 hours. (D) T1-weighted spin-echo images of extracted tumors. (E) T1-weighted fat saturation spin-echo images of extracted tumors. (F) T2-weighted turbo spin-echo images of extracted tumors. (G) T2-weighted fat saturation turbo spin-echo images of extracted tumors. Control samples comprised of 1 mg/mL nanoparticle solutions. Radiant efficiency was measured using arbitrary units. Scale bar represents 150 μm for (B) and 400 mm for (D–G).
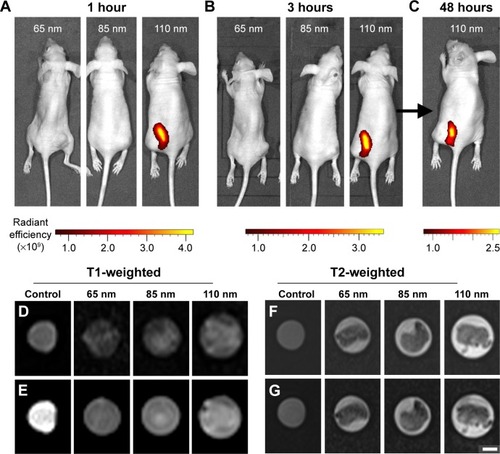
Figure S1 Size distribution histograms of the nanoparticle test solutions used.
Notes: (A) Histogram for 65 nm sized nanoparticle solution. (B) Histogram for 85 nm sized nanoparticle solution. (C) Histogram for 110 nm sized nanoparticle solution. µ represents the mean and σ represents the standard deviation.
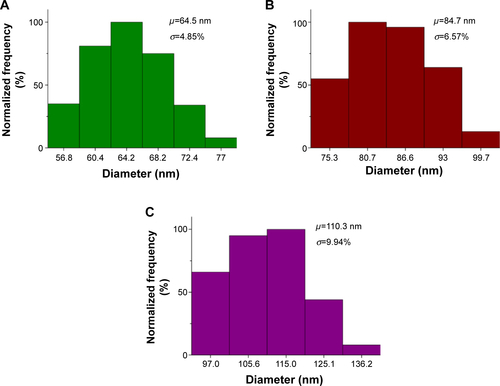
Figure S2 Positive control illustrating the uptake of free Rhodamine 6G (0.5 μg/mL) in the MCTS of the PANC-1 and MIA PaCa-2 cell lines.
Notes: (A) Normalized fluorescence intensity of the MCTS of the PANC-1 and MIA PaCa-2 cell lines at different time intervals. For MCTS models of PANC-1 cell line incubated with free Rhodamine 6G at 1 hour, 6 hours, and 24 hours, (B) bright field images, (C) fluorescence images, and (D) intensity maps showing the relative fluorescent intensity of different regions of the MCTS of PANC-1. For the MCTS of the MIA PaCa-2 cell line incubated with free Rhodamine 6G at 1 hour, 6 hours, and 24 hours, (E) bright field images, (F) fluorescence images, and (G) intensity maps showing the relative fluorescent intensity of different regions of the MCTS of MIA PaCa-2. The scale bar represents 100 μm. Error bars indicate the standard deviation and the number of samples used in each measurement (n=8). *Indicates statistical difference (P<0.05) between the fluorescent measurements at that time point of each cell line, based on the single variable analysis of variance test. No statistically significant difference was found between the fluorescent values of each cell line.
Abbreviations: MCTS, multicellular tumor spheroids; h, hours.
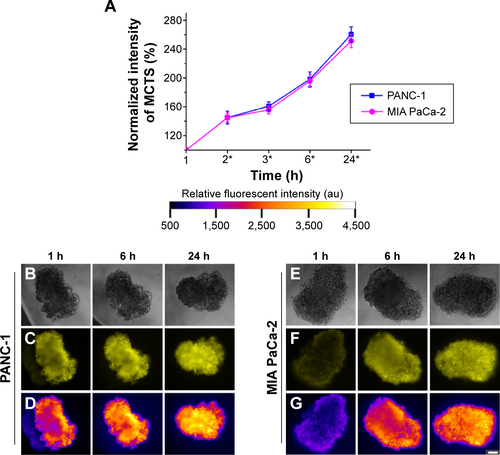
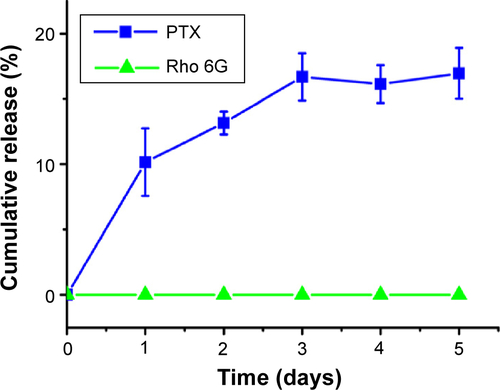
Figure S3 Paclitaxel (PTX) and Rhodamine 6G (Rho 6G) release at 4°C for all the three particle sizes (65 nm, 85 nm, and 110 nm) in PBS.
Abbreviation: PBS, phosphate buffered saline.