Figures & data
Figure 1 Characterization of GNP and Alb-GNPs.
Notes: (A) UV-Vis spectra of GNPs (red line) and BSA-GNP samples (blue line). (B) FT-IR spectra for GNP (red) and BSA-GNP (blue) in the 2,500–1,000 cm−1 region. (C) DLS size distribution curves for GNP (red) and BSA-GNP (green). (D) AFM image of a single BSA-GNP nanoparticle.
Abbreviations: GNP, gold nanoparticle; BSA, bovine serum albumin; IR, infrared; UV-Vis, ultraviolet visible; DLS, dynamic light scattering; AFM, atomic force microscopy.
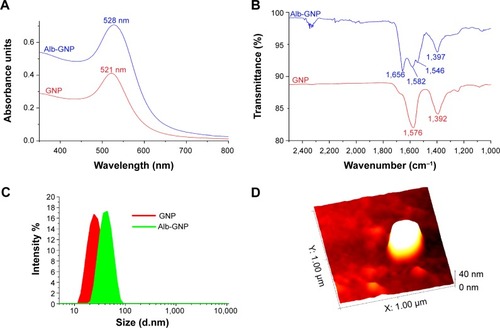
Figure 2 GNPs albumin-mediated in vitro endocytosis mechanism in human liver cancer cells.
Notes: Exposure to 50 μg/mL Alb-GNPs for 1 hour, 37°C. Dark field light microscopy images of Alb-GNPs uptake into Hep G2 cells or Hep B5 cells (control). Magnification: 80×.
Abbreviations: AU, absorbance units; Alb-GNPs, albumin-conjugated gold nanoparticles.
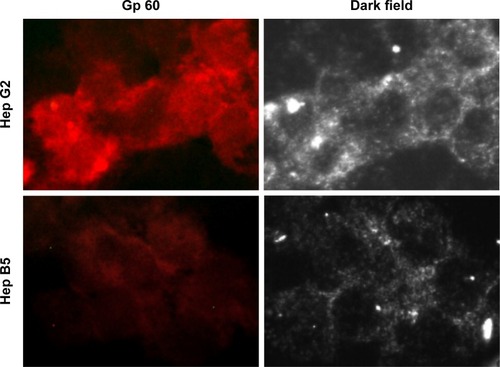
Figure 3 The concomitent detection of Golgi apparatus and ER function following Alb-GNPs mediated photothermal treatment.
Notes: Exposure to 10 μg/mL Alb-GNPs (1 hour, 37°C), followed by laser excitation (3 minutes, 808 nm, 2W/cm2). Upper row: HepB5 cells: normal red and green fluorescence is visible, suggesting that HepB5 cells function normally. Third row: HepG2 cells: red and green fluorescence is less visible, with mild architectural changes in both ER and Golgi. Second row: exposure to 50 μg/mL Alb-GNPs (1 hour, 37°C), followed by laser excitation (3 minutes, 808 nm, 2W/cm2). Bottom row: HepB5 cells: normal green fluorescence suggest a normal function of the GA, with mild disturbance of ER function. HepG2 cells: red and green fluorescence is less visible, with severe architectural changes in both ER and GA suggesting lack of function in these organelles. Magnification: 60×.
Abbreviations: ER, endoplasmic reticulum; GA, Golgi apparatus; Alb-GNPs, albumin-conjugated gold nanoparticles.
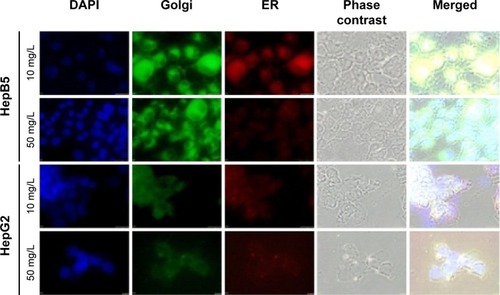
Figure 4 Detection of apoptosis using Annexin V-cy3.
Notes: Control sample followed standard cell culture conditions. Test cells were treated with Alb-GNPs with different concentrations 5, 10, and 50 μg/mL, respectively and laser irradiated. Consequently, all samples were stained with annexin-cy3 for 5 minutes (RT, dark). Nucleus staining was also performed using DAPI blue-fluorescence. Control sample (no Alb-GNPs exposure, no irradiation). No red fluorescence was observed. Exposure to 5 μg/mL Alb-GNPs (1 hour, 37°C), followed by laser excitation (3 minutes, 808 nm, 2W/cm2). Red fluorescence is displayed in a reduced number of cells, granular aspect coming from limited number of PS groups exposed on the outer surface of the membrane. Exposure to 10 μg/mL Alb-GNPs (1 hour, 37°C), followed by laser excitation (3 minutes, 808 nm, 2W/cm2), increased the number of early-apoptosis entrance cells. Red fluorescence aspect is diffuse, suggesting intense PS translocation process. Exposure to 50μg/mL Alb-GNPs (1 hour, 37°C), followed by laser excitation (3 minutes, 808 nm, 2W/cm2). The majority of cells present intense, diffuse, red Cy3 fluorescence covering the entire outer surface of the membrane suggesting a highly intense pro-apoptotic effect. Magnification: 60×.
Abbreviations: GNPs, gold nanoparticles; RT, room temperature; DAPI, 4′,6-diamidino-2-phenylindole; PS, phosphatidylserine; Alb, albumin.
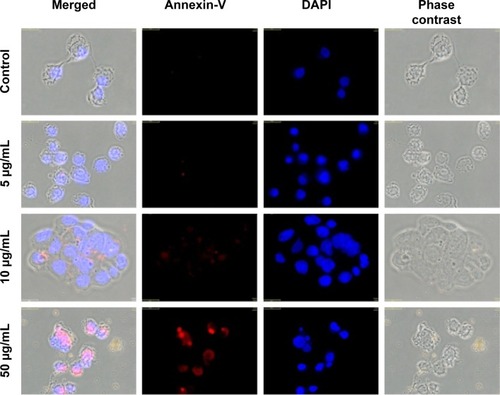
Figure 5 The concomitent detection of Golgi apparatus function and caspase 3 pathway.
Notes: Upper row: control sample (no Alb-GNPs exposure: low red fluorescence is visible, suggesting that Hep G2 cells have low apoptotic state under normal conditions; in contrast Golgi function is normal as suggested by green fluorescence. Middle row: exposure to 10 μg/mL Alb-GNPs (1 hour, 37°C), followed by laser excitation (3 minutes, 808 nm, 2W/cm2). Lower green fluorescence intensity staining combined with increased red fluorescence suggest low Golgi function with moderate activation of caspase 3 pathway. Bottom row: exposure to 50 μg/mL Alb-GNPs (1 hour, 37°C), followed by laser excitation (3 minutes, 808 nm, 2W/cm2). The majority of cells present intense, inhomogenuous, granular aspect of red fluorescence with lack of fluorescence staining suggesting an intense activation of caspase 3 apoptotic pathway. Magnification: 60×.
Abbreviation: Alb-GNPs, albumin-conjugated gold nanoparticles.
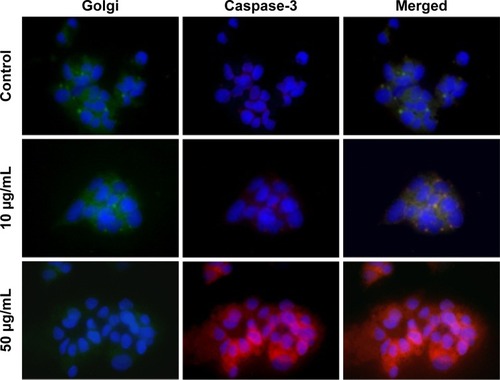
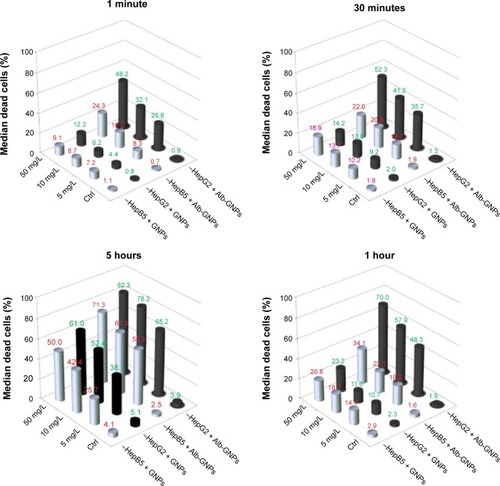
Figure 6 Cytotoxicity and photothermal activity in liver cancer cells and HepB5 cells following treatment with Alb-GNPs.
Notes: The results represent quantification by flow cytometry (%) of Annexin-Cy5 positive cells after photothermal treatment as described.
Abbreviations: Ctrl, control; Alb-GNPs, albumin-conjugated gold nanoparticles.