Figures & data
Figure 1 Absorption spectra (A and B) and TEM images (C) of different GNP.
Notes: (A) GNS absorption peak is at 520 nm (left) and GNR absorption peaks (B) are at 630 nm (GNR1, solid red line), 650 nm (GNR2, dashed violet line), and 760 nm (GNR3, dotted green line). The scattering spectra of the GNP are the same as the absorption spectra (data not shown, see Jain et alCitation18). (C) TEM images of GNS and GNR types 1–3. The average size was determined by measuring at least n=10 GNP.
Abbreviations: TEM, transmission electron microscopy; GNR, gold nanorods; GNP, gold nanoparticles; GNS, gold nanospheres.
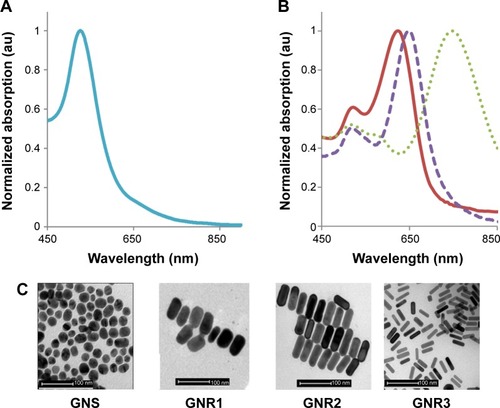
Figure 2 A schematic description of the experimental setup for linear reflected light intensity measurements.
Notes: The laser diode wavelengths were 650 nm and 780 nm and the sample is simultaneously irradiated (described as an arrow) on a single point on its surface. The photodiode was in close contact with the phantom’s surface. The micrometer plate moved 16 steps of 250 µm each, enabling continuous measurements of the spatial reflectance from 1 mm up to 5 mm from the laser diode position.
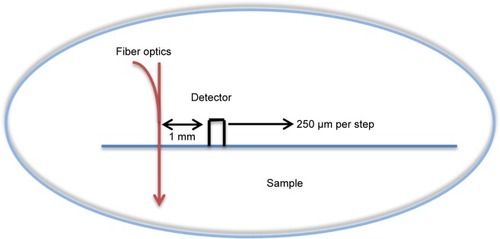
Figure 3 A schematic diagram of the measured phantoms.
Notes: (A) Three small phantoms containing macrophages (MΦ) without or with GNR2 or GNR3 were deposited on the surface of a baseline phantom, which contained IL and ink only. (B) As a second control, two additional phantoms, containing 0.2 mg/mL GNR2 or GNR3 only, were measured.
Abbreviations: GNR, gold nanorods; IL, intralipid.
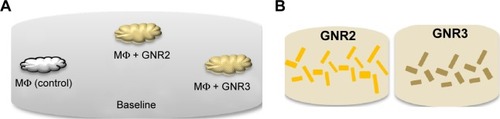
Figure 4 FCM analysis of human blood macrophages without (control) and with GNP loading.
Notes: CD11b + MΦ loaded with two concentrations of GNR1 (top) and GNS (bottom): 0.02 mg/mL and 0.2 mg/mL. The Rel MSI (%) (right) at 633 nm (middle and right panels, upper) and 561 nm (middle and right panels, bottom) of unlabeled cells were compared to cells with GNR1 or GNS, respectively. Left panel: absorption spectra of GNR1 and GNS. The dotted lines indicate the absorption (and scattering) intensities of the GNP at different laser lines of the FCM. Reflection was measured at 488 nm, 561 nm, and 633 nm according to the scattering peaks of the GNS and GNR1, respectively. Loading of both GNP was detected, and the signal increased with the increasing GNP concentration.
Abbreviations: FCM, flow cytometry; GNP, gold nanoparticles; GNR, gold nanorods; GNS, gold nanospheres; Rel MSI, relative mean scatter intensity.
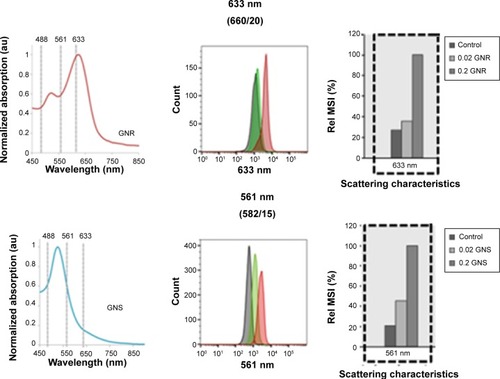
Figure 5 Diffusion reflection measurements of tissue-like phantoms.
Notes: (A) Average DR slopes of phantoms with 0.2 mg/mL GNR2 and GNR3 compared to a baseline phantom. Each GNR phantom was illuminated with wavelengths, 650 nm and 780 nm, simultaneously, and the results show significant higher slopes for phantoms containing GNR (P<0.001 for both types of GNR). (B) Three types of phantoms were measured as follows: one control phantom with macrophages only and two phantoms with macrophages loaded with 0.2 mg/mL of GNR2 or GNR3. The figure presents averaged slopes resulting from the DR measurement curves of the abovementioned phantoms. Each type of phantom was measured with two wavelengths (650 nm and 780 nm; the bars show mean of at least five repeats ±1 STD), simultaneously. *P<0.05; ***P<0.001.
Abbreviations: DR, diffusion reflection; GNR, gold nanorods; STD, standard deviation.
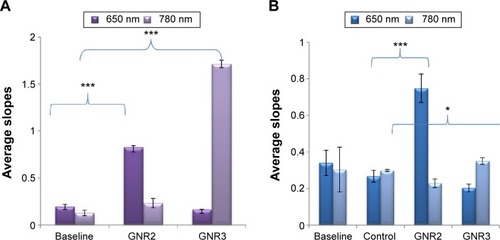
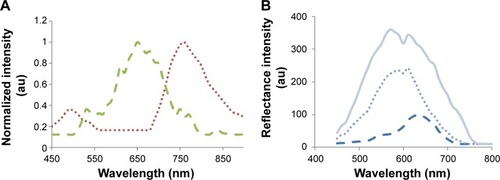
Figure 6 Hyperspectral microscopy measurements.
Notes: (A) Transmission measurements of bare GNR2 (dashed green line) and GNR3 (dotted red line) on slide. (B) GNR uptake by macrophages captured by the hyperspectral microscopy. Reflectance intensity from macrophages before (solid line) and 24 h post their incubation with 0.2 mg/mL of GNR2 (dashed line) and GNR3 (dotted line). The spectra of the macrophages that were not incubated with the GNR and of the macrophages that were incubated with GNR3 are very similar, presenting an intensity peak at approximately 580 nm, indicating a low GNR3 uptake. In contrast, macrophages that were incubated with GNR2 present a spectrum very much similar to the absorption peak of the GNR2, as was measured by the spectrophotometer.
Abbreviations: GNR, gold nanorods; h, hours.