Figures & data
Figure 1 Chemical structures of the terpenes, Tween 20, 5-doxyl stearic acid (5-DSA) and 16-doxyl stearic acid (16-DSA).
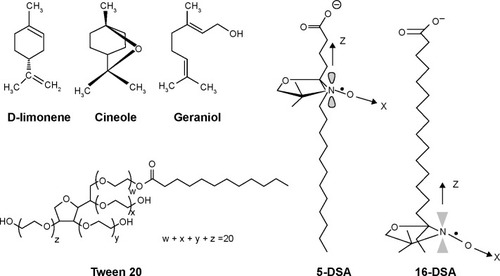
Table 1 Composition of NaFl-loaded liposomal formulations
Figure 2 (A) ESR spectrum of 5-DSA and (B) ESR spectrum of 16-DSA.
Abbreviations: AU, arbitrary unit; 5-DSA, 5-doxyl stearic acid; 16-DSA, 16-doxyl stearic acid; ESR, electron spin resonance.
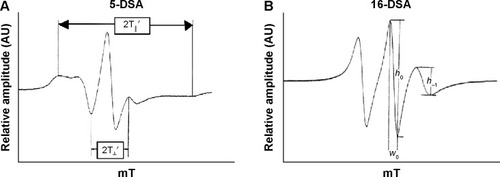
Table 2 Characterization parameters of different liposomal formulations
Table 3 ESR parameters (maximum hyperfine splitting and rotational correlation time) and in vitro skin penetration parameter (flux) of each liposomal formulation
Figure 3 Molecular structure of ultradeformable liposomes with terpenes.
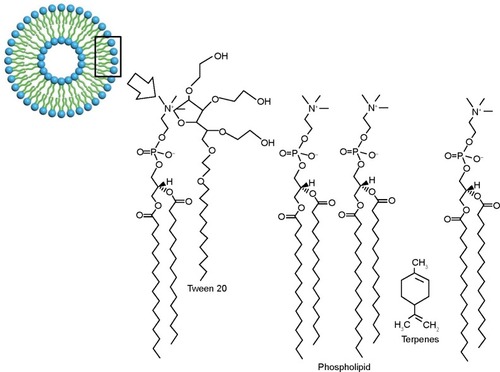
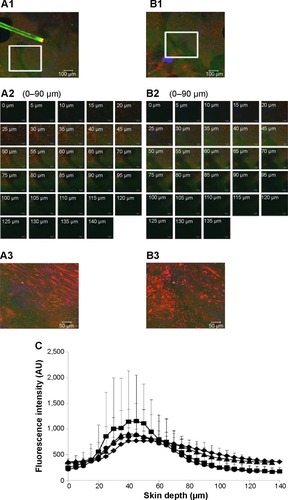
Figure 4 CLSM images of skin treated with CLs.
Notes: (A1 and B1) The x–y plane serial follicular and nonfollicular localization of porcine skin treated with NaFl-loaded Rh-PE-labeled CLs at 4 hours. The scale bar represents 100 µm. (A2 and B2) The serial x–z plane magnification of the marked area from the follicular and nonfollicular regions at different skin depths using a 20× objective lens. The scale bar represents 50 µm. (A3 and B3) The intensity over projection of z–axis images of A2 and B2, respectively. The scale bar represents 50 µm. The blue, green, and red fluorescence are the autofluorescence, NaFl, and Rh-PE, respectively. (C) Comparison of fluorescence intensity profiles of NaFl and Rh-PE at different skin depths of A2 (♦, NaFl; ■, Rh-PE) and B2 (▲, NaFl; •, Rh-PE).
Abbreviations: AU, arbitrary unit; CLs, conventional liposomes; CLSM, confocal laser scanning microscopy; NaFl, sodium fluorescein; Rh-PE, rhodamine B 1,2-dihexadecanoyl-sn-glycero-3-phosphoethanolamine triethylammonium salt.
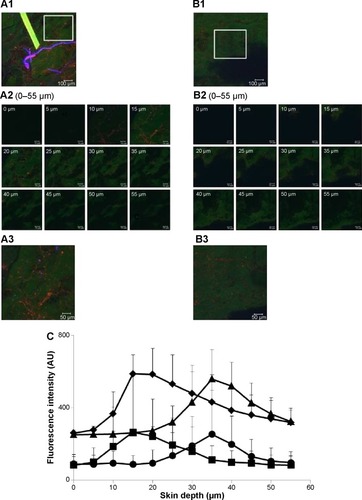
Figure 5 CLSM images of skin treated with ULs.
Notes: (A1 and B1) The x–y plane serial follicular and nonfollicular localization of porcine skin treated with NaFl-loaded Rh-PE-labeled UL at 4 hours. The scale bar represents 100 µm. (A2 and B2) The serial x–z plane magnification of the marked area from the follicular and nonfollicular regions at different skin depths using a 20× objective lens. The scale bar represents 50 µm. (A3 and B3) The intensity over projection of the z-axis images of A2 and B2, respectively. The scale bar represents 50 µm. The blue, green, and red fluorescence are the autofluorescence, NaFl, and Rh-PE, respectively. (C) Comparison of the fluorescence intensity profiles of NaFl and Rh-PE at different skin depths of A2 (♦, NaFl; ■, Rh-PE) and B2 (▲, NaFl; •, Rh-PE).
Abbreviations: AU, arbitrary unit; CLSM, confocal laser scanning microscopy; NaFl, sodium fluorescein; Rh-PE, rhodamine B 1,2-dihexadecanoyl-sn-glycero-3-phosphoethanolamine triethylammonium salt; ULs, ultradeformable liposomes.
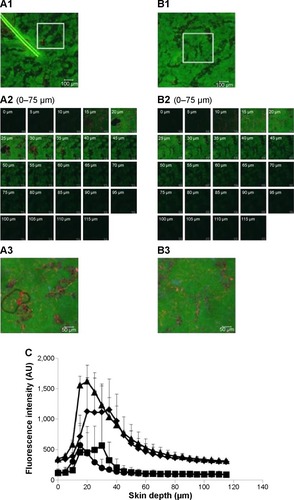
Figure 6 CLSM images of skin treated with ULs with 1% cineole.
Notes: (A1 and B1) The x–y plane serial follicular and nonfollicular localization of porcine skin treated with NaFl-loaded Rh-PE-labeled ULs with 1% cineole at 4 hours. The scale bar represents 100 µm. (A2 and B2) The serial x–z plane magnification of the marked area from the follicular and nonfollicular regions at different skin depths using a 20× objective lens. The scale bar represents 50 µm. (A3 and B3) The intensity over projection of z-axis images of A2 and B2, respectively. The scale bar represents 50 µm. The blue, green, and red fluorescence are the autofluorescence, NaFl, and Rh-PE, respectively. (C) Comparison of the fluorescence intensity profiles of NaFl and Rh-PE at different skin depths of A2 (♦, NaFl; ■, Rh-PE) and B2 (▲, NaFl; •, Rh-PE).
Abbreviations: AU, arbitrary unit; CLSM, confocal laser scanning microscopy; NaFl, sodium fluorescein; Rh-PE, rhodamine B 1,2-dihexadecanoyl-sn-glycero-3-phosphoethanolamine triethylammonium salt; ULs, ultradeformable liposomes.