Figures & data
Figure 1 Photographs of aspirin-containing nanoemulsions of the present study by transmission electron microscopy.
Notes: (A) Shows the size of one of the obtained nanoparticles which equals 155nm. (B) Shows an obtained nanoparticle with sphere shape and 200 nm diameter. (C) Shows a nanoparticle which is 181.5 nm. (D and E) Shows dispersed aspirin nanoparticles with a sphere shape.
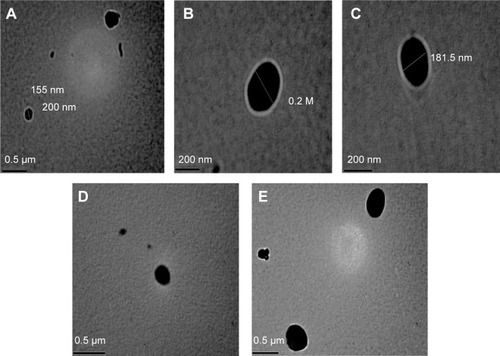
Table 1 Primers of the tested parameters
Figure 2 Effect of negative control, aspirin, blank nanoemulsion, and aspirin nanoemulsion on TNFα level in gastric tissue.
Notes: *Significant compared to control; #significant compared to aspirin (group 3).
Abbreviation: SD, standard deviation.
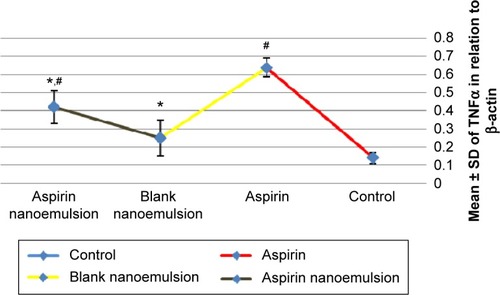
Figure 3 Effect of negative control, blank nanoemulsion, aspirin, and aspirin nanoemulsion on iNOS level in gastric tissue.
Notes: *Significant compared to control; #significant compared to aspirin (group 3).
Abbreviation: SD, standard deviation.

Figure 4 Effect of negative control, blank nanoemulsion, aspirin, and aspirin nanoemulsion on PGE-2 level in gastric tissue.
Notes: *Significant compared to control; #significant compared to aspirin (group 3).
Abbreviations: SD, standard deviation; PGE-2, prostaglandin E2.
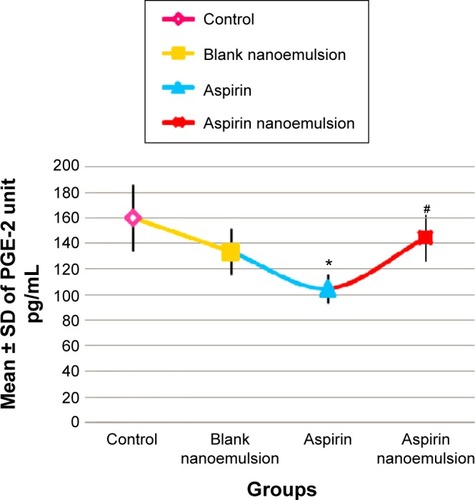
Table 2 Levels of GSH, GR, and GPx in gastric tissue in different groups
Table 3 Levels of catalase, SOD, and MDA in gastric tissue in different groups
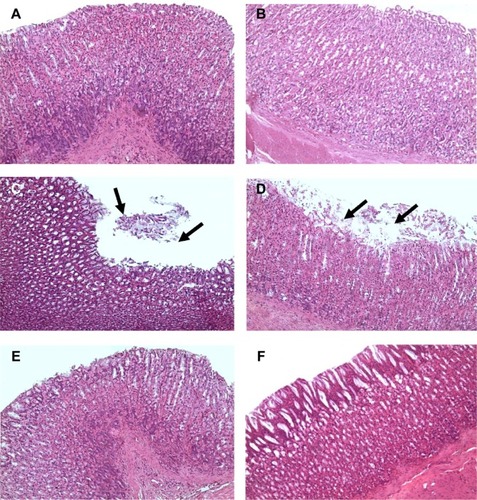
Figure 5 Photomicrographs.
Notes: (A, B) Stomachs of the control group (group 1) and blank nanoemulsion-treated group (group 2), showing normal stomach architecture (H&E, 200×); (C, D) stomachs of the aspirin-treated group (group 3), showing massive sloughing of the superficial parts of gastric glands (arrows) (H&E, 200×). (D) shows more damaged epithelium than in (C) and the sloughing tissue occurs at a larger area. (E, F) stomachs of the aspirin nanoemulsion-treated group (group 4), showing normal gastric gland architecture (H&E, 200×). (F) Shows more healthy and intact gastric epithelium with no inflammatory cells infiltration than in (E).
Abbreviation: H&E, hematoxylin and eosin.