Figures & data
Table 1 Particle size of carvedilol microsuspensions and nanosuspensions (mean ± SD, n=3)
Figure 1 SEM micrographs.
Notes: SEM micrographs of (A) carvedilol coarse powder, (B) microsuspensions, and (C) nanosuspensions.
Abbreviations: EHT, extra high tension; SEM, scanning electron microscopy; WD, working distance.
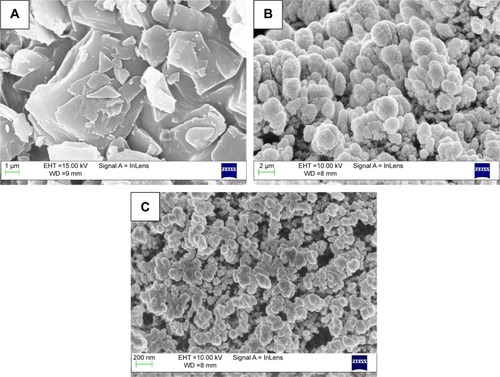
Figure 2 DSC profiles.
Notes: DSC profiles of freeze-dried nanosuspension powder (A), freeze-dried microsuspension powder (B), physical mixture (C), SDS powder (D), VES powder (E), and coarse carvedilol powder (F).
Abbreviations: DSC, differential scanning calorimetry; SDS, sodium dodecyl sulfate; VES, α-tocopherol succinate.
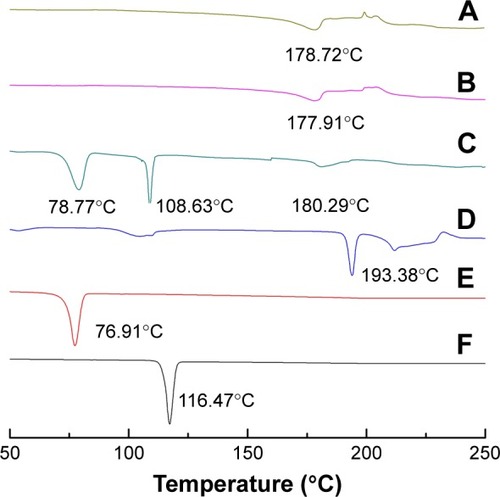
Figure 3 PXRD patterns.
Notes: PXRD patterns of freeze-dried nanosuspension powder (A), freeze-dried microsuspension powder (B), physical mixture (C), SDS powder (D), VES powder (E), and coarse carvedilol powder (F).
Abbreviations: PXRD, powder X-ray diffractometry; SDS, sodium dodecyl sulfate; VES, α-tocopherol succinate.
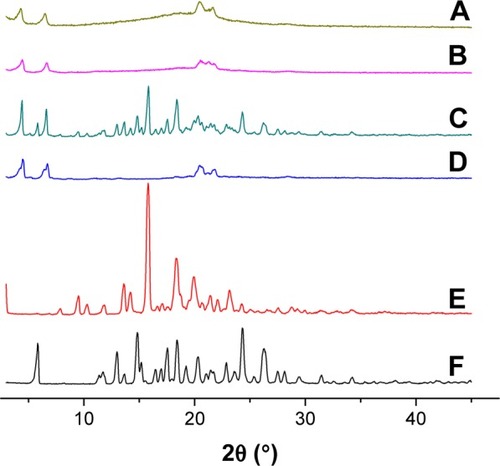
Figure 4 Dissolution profiles.
Notes: Dissolution profiles of bulk carvedilol, the commercial tablet, microsuspensions, and nanosuspensions: buffer of pH 1.0 (A); buffer of pH 6.8 (B). Each value represents the mean ± SD (n=3).
Abbreviation: CAR, carvedilol.
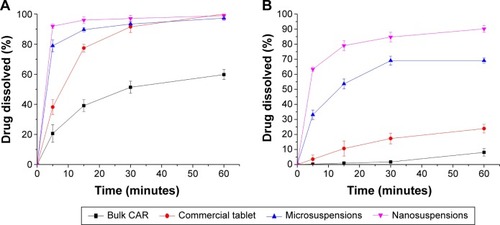
Figure 5 In situ absorption.
Notes: The in situ absorption of microsuspensions and nanosuspensions in rat intestinal segments compared with free carvedilol solution. *Indicates P<0.05 versus free carvedilol solution.
Abbreviation: Peff, effective permeability.
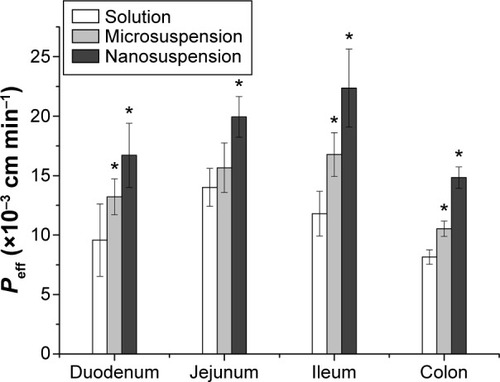
Table 2 In vivo parameters of carvedilol microsuspensions, nanosuspensions, and the commercial tablets after oral administration (n=6)
Figure 6 Pharmacokinetics profiles.
Notes: In vivo pharmacokinetics profiles of carvedilol in beagle dogs following oral administration of commercial tablets, and microsuspension and nanosuspension capsules (n=6).
Abbreviations: MS, microsuspension; NS, nanosuspension.
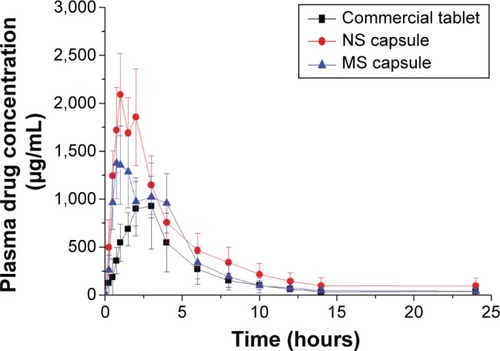
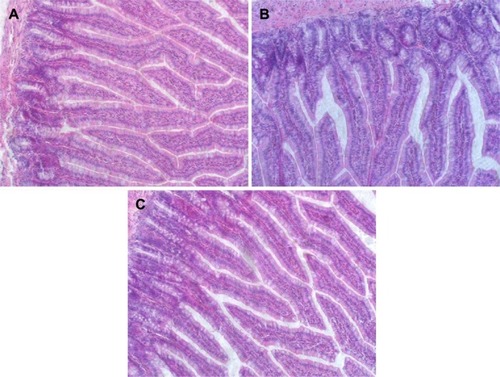
Figure 7 Morphology of rat jejunum cross section.
Notes: Morphology of rat jejunum cross section after oral administration of physiological saline (A), coarse suspensions (B), and nanosuspensions (C). The magnification of the images is 200×.