Figures & data
Figure 1 Antibody binding to gold nanoparticles and characterization.
Notes: (A) Gold nanoparticles are maleimide activated. Monoclonal antibodies are sulfhydryl activated at the N-terminus by SATA. Under buffered conditions and at neutral pH, a covalent binding of the antibodies with the gold nanoparticles takes place. (B) After coating with the Hsp70-specific antibody cmHsp70.1 (Au-Hsp70) or an irrelevant control antibody of the same isotype mouse IgG1 (Au-IgG) the size of the particles was measured by dynamic light scattering compared to uncoated particles (Au-NP). The hydrodynamic diameter is shown. Each time three measurements were performed. Mean values of a typical experiment are shown representing the hydrodynamic diameter. Data are presented as mean ± standard deviation.
Abbreviations: SATA, N-succinimidyl S-acetylthioacetate; Au-NPs, gold nanoparticles.
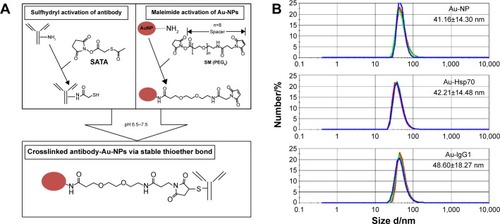
Figure 2 Vehicle specificity of antibody-coated gold nanoparticle uptake.
Notes: CT26 mouse colon carcinoma cells were incubated with antibody-coated or uncoated gold nanoparticles at a concentration of 1 µg/mL for 24 hours at 37°C. (A) cmHsp70.1-coated gold nanoparticles (Au-Hsp70) were internalized into cells and are visible in the cytoplasm (arrows) and in perinuclear areas (arrowhead). (B) Gold nanoparticles coated with an isotype matched irrelevant control antibody (Au-IgG) were internalized to a much lower extent (arrows), and (C) uncoated gold nanoparticles (Au-NP) were not internalized or internalized randomly with low frequency (as indicated with an arrow). (D) Black dots representing nanoparticles are not detectable in unstained cells (bright field, objective 63×, scale bar 20 µm).
Abbreviation: w/o, without.
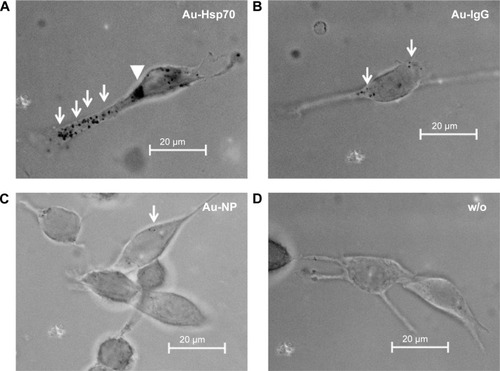
Figure 3 Target specificity of antibody-coated gold nanoparticle (Au-Hsp70) uptake.
Notes: 4T1 mouse mammary carcinoma cells were incubated with antibody-coated nanoparticles (1 µg/mL) for 24 hours at 37°C. (A) In 100% of the 4T1 cells with a wild-type expression of Hsp70, cmHsp70.1-coated nanoparticles could be detected as black dots (arrows). (B) In transfected cells, 4T1 Hsp70−/− cells with knocked down Hsp70, no uptake of nanoparticles could be detected. (C) The successful knock down of Hsp70 in 4T1 Hsp70−/− cells was verified by Western blotting compared with the expression of Hsp70 in the cytosol of 4T1 wt cells. Images are representative for at least three independent experiments. (A and B bright field, objective 40×, scale bar 20 µm.)
Abbreviation: wt, wild-type.
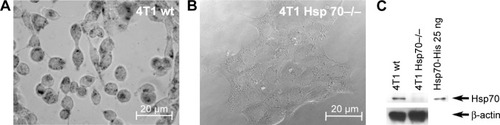
Figure 4 Intracellular distribution of uptaken gold nanoparticles (Au-Hsp70) in CT26 cells.
Notes: Upon internalization after 24 hours (A) cmHsp70.1-coated gold nanoparticles are visible in vesicle-like structures in the cytoplasm (B) finally aggregating in lysosome-like structures near the nucleus (C). (B) and (C) are higher magnification images derived from insets [1] and [2] in (A). (scale bar 20 µm in [A] and 5 µm in [B] and [C]).
![Figure 4 Intracellular distribution of uptaken gold nanoparticles (Au-Hsp70) in CT26 cells.Notes: Upon internalization after 24 hours (A) cmHsp70.1-coated gold nanoparticles are visible in vesicle-like structures in the cytoplasm (B) finally aggregating in lysosome-like structures near the nucleus (C). (B) and (C) are higher magnification images derived from insets [1] and [2] in (A). (scale bar 20 µm in [A] and 5 µm in [B] and [C]).](/cms/asset/39d301e4-aac4-447e-9a76-db8502b927c9/dijn_a_87174_f0004_c.jpg)
Figure 5 Accumulation of antibody-coated gold nanoparticles (Au-Hsp70) in perinuclear areas of CT26 cells.
Notes: (A) A total of 48-hours postincubation gold nanoparticles are visible in aggregates in perinuclear areas (arrows). (B) Defining the areas of interest from (A). (C) Identification of black areas in bright field images by measuring the gray values in gray scale images. X- and Y-axis are defining the area of the cell. Z-axis defines the gray values. (A–C) Arrows correspond to each other.
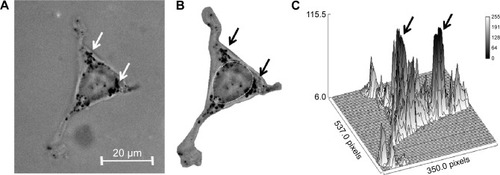
Figure 6 Quantification of gold nanoparticles uptake in single CT26 cells.
Notes: (A) After imaging cells with uptaken gold nanoparticles, a measurement line is set in 2-D images representing one slice of a cell. Measurement of the gray values along this line where low values (0) is defined as black, high values as white. A representative image with cmHsp70.1-coated nanoparticles is shown. (B) Analogously, lines were set in cells incubated with other particles. Shown are typical example curves of uncoated (blue), BSA coated (green) or isotype antibody coated (red) compared with the line of cmHsp70.1-coated particles (black). (C) Summing up the reciprocal gray values indicating a significant higher uptake of cmHsp70.1-coated Au particles in Hsp70-membrane-positive CT26 cells compared to uncoated- or isotype-coated particles (*P<0.05, **P<0.01).
Abbreviations: 2-D, two dimensional; BSA, bovine serum albumin; w/o, without.
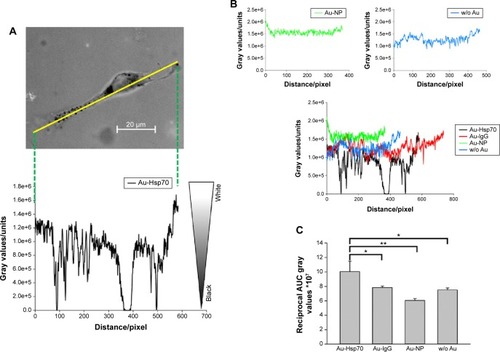
Figure 7 Uptake of antibody-coated gold nanoparticles by clustered mouse carcinoma cells.
Notes: cmHsp70.1 antibody-coated gold nanoparticles (Au-Hsp70) can be visualized in mouse carcinoma cells lines after incubation at 37°C for 16 hours. The particles are visible as black agglomerates inside the cells (arrows). In clusters of CT26 cells (A) similar amounts of particles can be detected as in 4T1 single cells (B) (bright field, objective 40×, scale bar 50 µm).
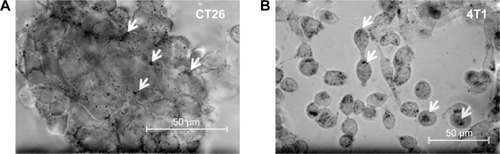
Figure S1 Aggregation assay.
Notes: The size and the aggregation of gold nanoparticles were measured by dynamic light scattering assays. Data from freshly prepared gold nanoparticles conjugated with cmHsp70.1 antibody are shown in red. Upon storage for 4 weeks at 4°C peaks are visible with a size above 100 nm (green). These data show an increased aggregation of the nanoparticles during storage. For all cell-based experiments only freshly prepared nanoparticles with a single peak in the hydrodynamic diameter of ~40 nm were used. The graph shows a representative measurement of cmHsp70.1-coated gold nanoparticles either freshly prepared (red) or after 4 weeks of storage at 4°C (green).
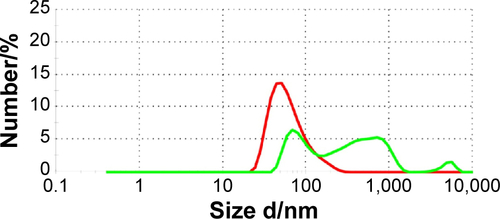
Figure S2 Annexin V assay.
Notes: Tumor cells were seeded in 12-well chamber slides and grown overnight. After an incubation of the cells with gold nanoparticles (concentration of 1 µg/mL) for 24 hours, cells were trypsinized and incubated with Annexin-V-FLUOS. Cells were analyzed on a FACS Calibur instrument. Annexin-V-positively stained cells were considered as apoptotic. As a positive control for apoptosis, cells were incubated with campthotecin (1 µg/mL, 24 hours) (CAM). No difference in cell viability was observed in cells incubated with the different gold nanoparticles either unconjugated (Au-NP) or conjugated (Au-IgG, Au-Hsp70), or cells that were not incubated with nanoparticles (w/o); (A) CT26, (B) 4T1 wt, (C) 4T1 Hsp70−/− (n=3). Although basal apoptosis was slightly higher in 4T1 wt and 4T1 Hsp70−/− cells compared to CT26 cells, the incubation with gold nanoparticles did not further increase apoptosis.
Abbreviations: w/o, without; FACS, fluorescent activated cell sorting.
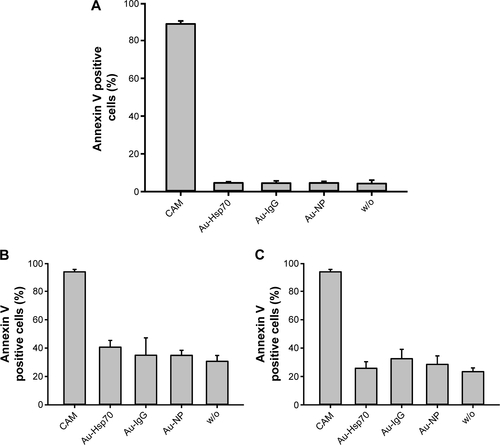
Figure S3 Cell viability assay.
Notes: Cells were seeded in 12-well chamber slides, incubated for 24 hours, 48 hours, or 72 hours with gold nanoparticles (Au-NP, Au-IgG, Au-Hsp70) or left untreated (w/o). Adherent cell colonies were counted 24 hours, 48 hours, and 72 hours after incubation with the gold nanoparticles and then stained with crystal violet. Colonies were counted automatically, and colony counts after 24 hours were set to 1. Shown are mean values of three independent experiments obtained with CT26 cells. For each plate, at least 30 colonies were counted in triplicates.
Abbreviation: w/o, without.
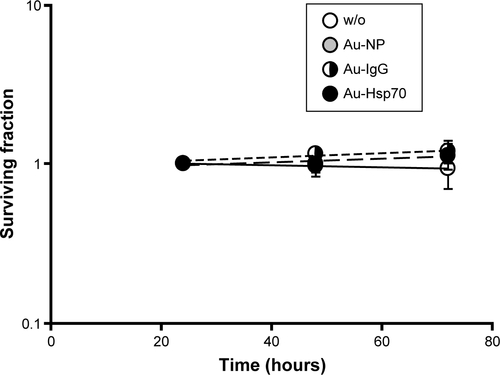
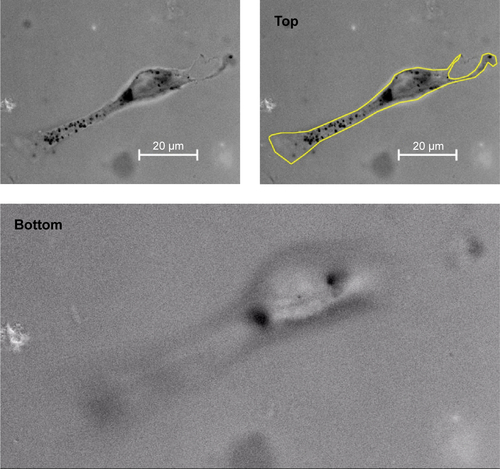
Figure S4 Representative view of a Z-stack light microscopic analysis of a CT26 tumor cell after incubation with Au-Hsp70 gold nanoparticles for 24 hours to demonstrate intracellular localization of the Au-Hsp70.
Notes: Magnification of 100×/1.3 oil using an EC plan-Neofluar objective, 15 ms; 22 slices were taken of the cells from the top to the bottom. The size of a single black dot was <500 nm, the size of the aggregates of black dots was ~2–3 µm. The scale bar indicates 20 µm. The yellow line depicts the outer plasma membrane of the cell at top position.
Abbreviation: ms, millisecond.