Figures & data
Figure 1 Effect of DPDS-NCS in the TBARS induced by Fe(II) in vitro in the brain (A) and in the liver (B).
Notes: Data are shown as mean ± SEM, n=4. *Represent a significant difference if compared with the induced group by Newman–Keuls test, P<0.05.
Abbreviations: DPDS-NCS, diphenyl diselenide-loaded nanocapsules; TBARS, thiobarbituric acid-reactive substances; SEM, standard error of the mean; MDA, malonldialdehyde.
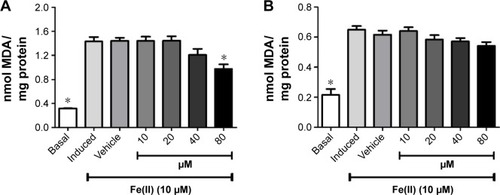
Figure 2 Effect of DPDS-NCS in the ROS production in vitro in the brain (A) and in the liver (B).
Notes: Data are shown as means ± SEM, n=4. *Represent a significant difference if compared with the basal group by Newman–Keuls test, P<0.05.
Abbreviations: DPDS-NCS, diphenyl diselenide-loaded nanocapsules; ROS, reactive oxygen species; SEM, standard error of the mean; DCF, dichloro-dihydrofluorescein.
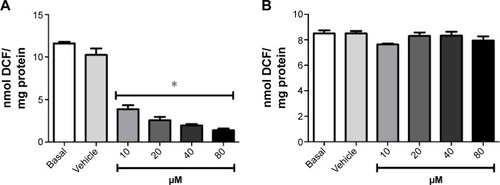
Figure 3 Effect of DPDS-NCS in the TBARS ex vivo in the brain (A) and in the liver (B).
Notes: Data are shown as means ± SEM, n=4. *Represent a significant difference if compared with the control group by Newman–Keuls test, P<0.05.
Abbreviations: DPDS-NCS, diphenyl diselenide-loaded nanocapsules; TBARS, thiobarbituric acid-reactive substances; SEM, standard error of the mean; MDA, malonldialdehyde.
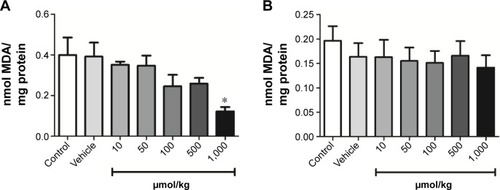
Figure 4 Effect of DPDS-NCS administration in the lipid peroxidation production induced in the brain by Fe(II) (A) and SNP (C) and in the liver by Fe(II) (B) and SNP (D).
Notes: Data are shown as means ± SEM, n=4. *Represent a significant difference if compared with the control group by Newman–Keuls test, P<0.05.
Abbreviations: DPDS-NCS, diphenyl diselenide-loaded nanocapsules; SNP, sodium nitroprusside; SEM, standard error of the mean.
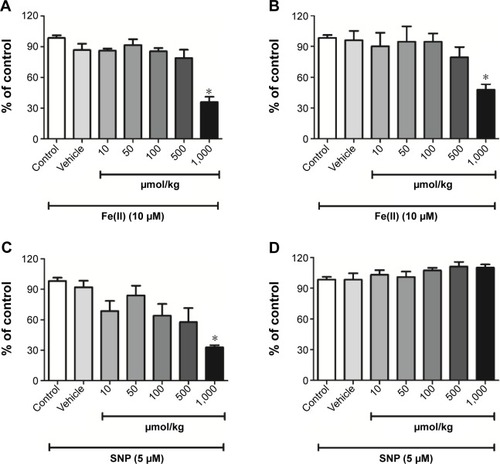
Figure 5 Effect of DPDS-NCS administration in the ROS production in the brain (A) and in the liver (B).
Notes: Data are shown as means ± SEM, n=4. *Represent a significant difference if compared with the control group by Newman–Keuls test, P<0.05.
Abbreviations: DPDS-NCS, diphenyl diselenide-loaded nanocapsules; ROS, reactive oxygen species; SEM, standard error of the mean; DCF, dichloro-dihydrofluorescein.

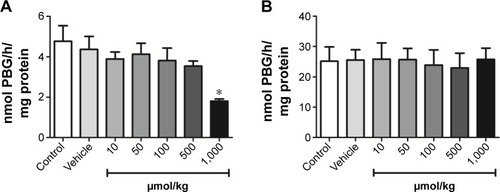
Figure 6 Effect of DPDS-NCS administration in the brain (A) and in the liver (B) δ-ALA-D.
Notes: Data are shown as means ± SEM, n=4. *Represent a significant difference if compared with the control group by Newman–Keuls test, P<0.05.
Abbreviations: DPDS-NCS, diphenyl diselenide-loaded nanocapsules; δ-ALA-D, δ-aminolevulinic acid dehydratase; SEM, standard error of the mean; PBG, porphobilinogen.