Figures & data
Table 1 Concentration and ζ-potential values of AgNPs prepared using cranberry powder aqueous extracts (Crs) of different concentrations
Figure 1 Transmission electron microscopy images and corresponding histograms showing particle-size distribution and PDIs of AgNPs prepared using cranberry powder aqueous extracts (Crs) of different concentrations: (A) Cr 0.2%; (B) Cr 0.5%; (C) Cr 0.8%.
Abbreviations: AgNPs, silver nanoparticles; PDI, polydispersity index.
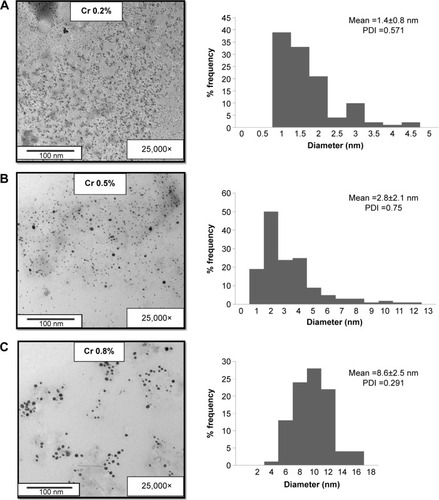
Figure 2 Silver nanoparticles prepared using different concentrations (0.2%, 0.5%, and 0.8% w/v) of cranberry powder aqueous extracts (Crs).
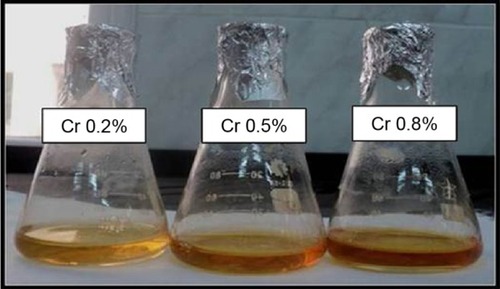
Figure 3 Ultraviolet-visible spectra of silver nanoparticles prepared using different concentrations of cranberry powder aqueous extracts (Crs).
Abbreviation: Abs, absorbance.
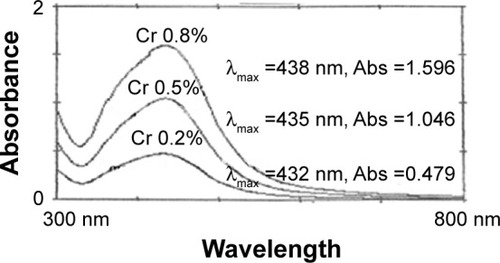
Figure 4 Fourier-transform infrared spectra.
Notes: Purified green-synthesized silver nanoparticles obtained after bioreduction (red line) and cranberry dry-powder extract (black line).
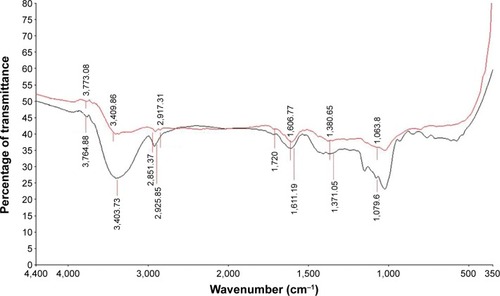
Table 2 MIC and MLC values of the different AgNP formulations for various organisms
Figure 5 Killing curve of AgNPs prepared using 0.2% cranberry powder aqueous extract (Cr 0.2%) against (A) Pseudomonas aeruginosa ATCC 9027; (B) Staphylococcus aureus ATCC 6538P.
Abbreviation: AgNPs, silver nanoparticles.
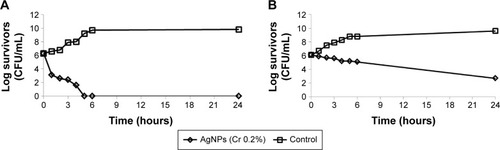
Figure 6 Scanning electron microscopy images.
Notes: Cultures of Pseudomonas aeruginosa ATCC 9027 (A and B) and Staphylococcus aureus ATCC 6538P (C and D). The left pane (A and C) depicts control cultures, while the right pane (B and D) involves cultures treated with AgNPs (Cr 0.2%) for 3.5 (B) and 8 (D) hours, respectively.
Abbreviations: AgNPs, silver nanoparticles; Cr, cranberry powder aqueous extract.
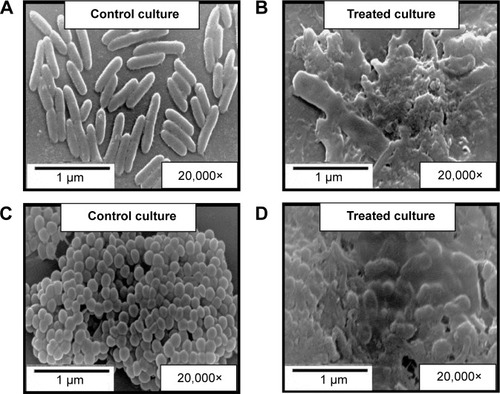
Figure 7 Digital photographs showing the healing progress of excision Staphylococcus aureus-infected wounds in rats.
Abbreviation: AgNP, silver nanoparticle.
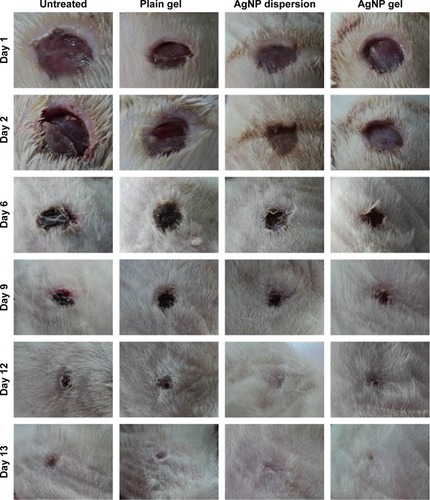
Figure 8 Percentage mean wound closure over a period of 13 days, measured morphometrically.
Note: n=10 in all groups, except for the untreated group, where n=8.
Abbreviation: AgNP, silver nanoparticle.
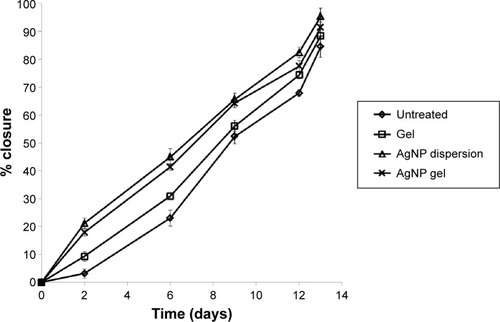
Table 3 Percentage of infected excision wounds and number of fatalities in rats treated with AgNP gel in comparison to rats treated with AgNP dispersion, rats treated with plain gel, and untreated rats, during 8 days of the study period
Figure 9 Histological examination at a magnification power of 100× of a section in normal rat skin.
Notes: Stained with hematoxylin and eosin (A) and Masson’s trichrome (B).
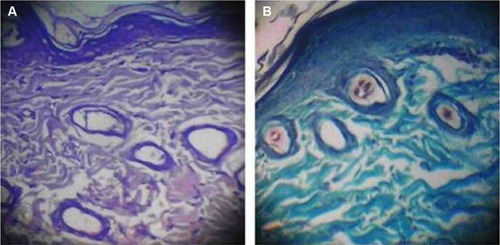
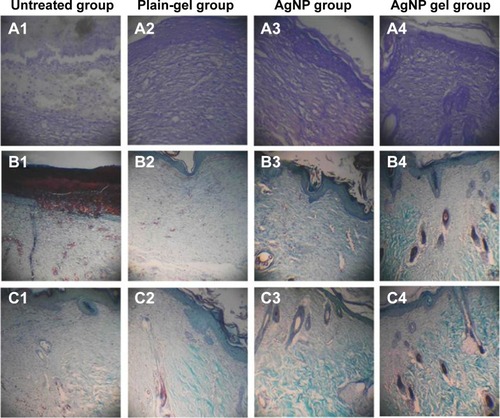
Figure 10 Histological examination of excision wounds in rat skin of different animal groups.
Notes: (A1–A4) Wound bed stained with hematoxylin and eosin (magnification 100×). Wound bed (B1–B4) and edge (C1–C4) stained with Masson’s trichrome (magnification 40×).
Abbreviation: AgNP, silver nanoparticle.