Figures & data
Figure 1 Nose–sinus airway model.
Notes: (A) There are three anatomical barriers in the nasal airway preventing effective sinus delivery: 1) the nasal valve, 2) the slit opening to the middle meatus, and 3) the ostium to the maxillary sinus. (B) Lateral and front view of the left nasal passage with the ostium and maxillary sinus. A body-fitted mesh is implemented in the near-wall region.
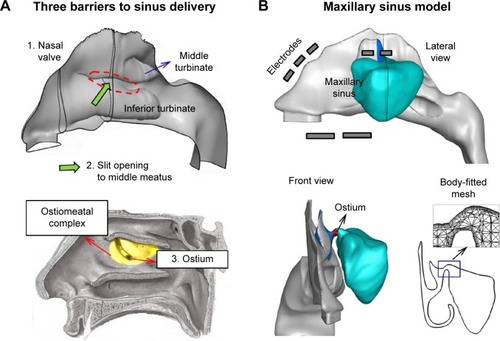
Table 1 Design variables of the electric-guided delivery system to the ostiomeatal complex
Figure 2 Airflow dynamics in the nasal-sinus airway.
Notes: (A) <10% of inhaled air is ventilated into the middle meatus. (B) Even less portion (<0.1%) of inhaled air is ventilated into the sinus. Only airflows originated at the middle outer nostril can possibly enter the sinus; airflows originated at other regions will pass through the median passages of the nose. (C) There is almost no pressure difference between the ostium and sinus. The airflow motion inside the sinus is extremely slow relative to the flows in the main nasal chamber.
Abbreviations: SM, superior meatus; MM, middle meatus; MP, median passage; IM, inferior meatus.
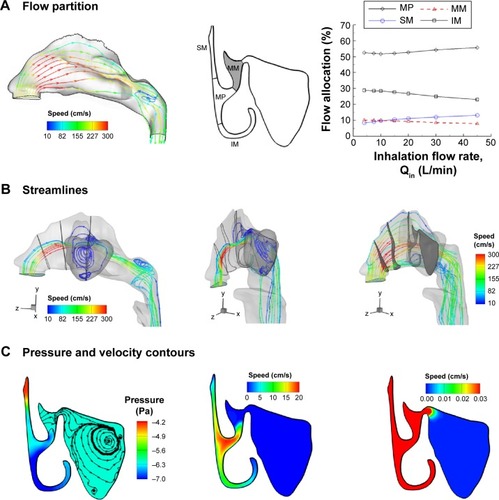
Figure 3 Point-release position and particle deposition.
Notes: (A) Selection of point-release position using an inverse method and (B) the resultant particle surface deposition without electric guidance. Particles that deposit in the sinus are traced back to their initial-release position. Particles introduced from the rectangle have more chances to enter the sinus. The area of the rectangle is fixed at 5.25 mm2, while the width and length (a × b) can change. An extremely low fraction of inhaled particles (0.1%) deposits in the sinus.
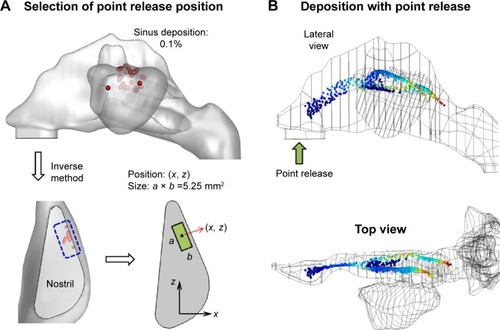
Figure 4 Parameter selection for electric and magnetic fields applicable to the design of a paranasal delivery system.
Notes: (A) Electric field, and (B) magnetic field.
Abbreviation: M, magnetization.
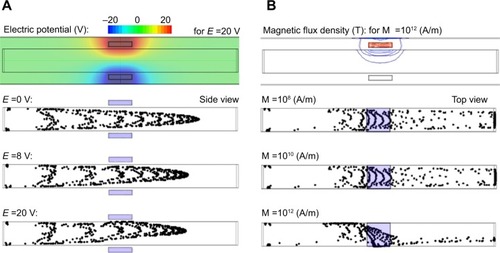
Figure 5 Electrode layout and performance of a baseline design.
Notes: (A) Diagram of the electrode layout with three groups and the electric potential field; (B) desirable path of particles for effective OMC delivery, and (C) depositions with the baseline delivery system. Each electrode group in the proposed delivery system has a designated function. E-group 1 aims to reduce drug deposition in the nasal valve, E-group 2 aims to push particles into the middle meatus, and E-group 3 aims to attract particles to the sinus ostium. Point-release was used to minimize drug loss in regions other than the target.
Abbreviations: OMC, ostiomeatal complex; T, top; B, bottom; C, cone.
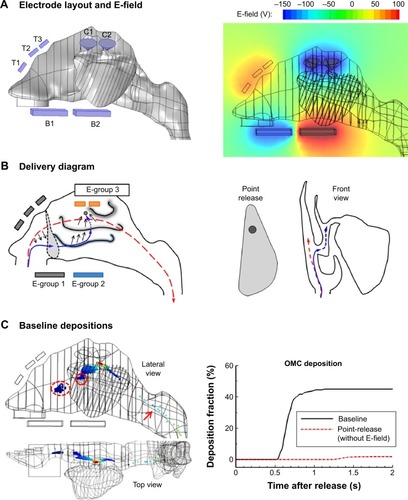
Figure 6 Sensitivity analysis of design variables influencing the OMC delivery efficiency.
Notes: There are 14 design variables in total, which fall into three categories: device-related, particle-related, and patient-related. Each variable was varied by ±10% of the baseline value. The sensitivity results are shown as the percent change from the baseline OMC dose.
Abbreviation: OMC, ostiomeatal complex.
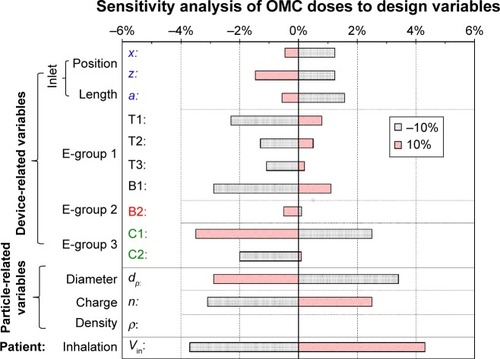
Figure 7 Optimization of the release position (x, z) at the nostril inlet.
Notes: (A) The objective (ie, OMC dose) as a function of the release position, (B) the Nelder-Mead optimization sequence with triangles (Tk) converging to the point (10.2, 6.1 [mm]), (C) particle deposition pattern with the optimized inlet position, and (D) the time evolution of olfactory deposition for OMC deposition with and without inlet-position optimization.
Abbreviations: OMC, ostiomeatal complex; s, seconds.
![Figure 7 Optimization of the release position (x, z) at the nostril inlet.Notes: (A) The objective (ie, OMC dose) as a function of the release position, (B) the Nelder-Mead optimization sequence with triangles (Tk) converging to the point (10.2, 6.1 [mm]), (C) particle deposition pattern with the optimized inlet position, and (D) the time evolution of olfactory deposition for OMC deposition with and without inlet-position optimization.Abbreviations: OMC, ostiomeatal complex; s, seconds.](/cms/asset/b2c02c3a-ef75-400d-8ab9-6e28c9d05de6/dijn_a_87382_f0007_c.jpg)
Figure 8 Particle deposition patterns with single-component optimizations.
Notes: (A) Device-related, (B) particle-related, and (C) patient-related components. The comparison of OMC delivery efficiency among single-component optimizations is shown in (D).
Abbreviations: E-1, E-group 1; E-2, E-group 2; E-3, E-group 3; OMC, ostiomeatal complex.
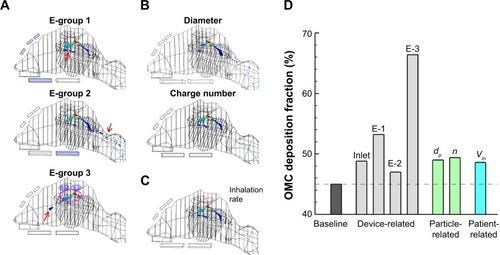
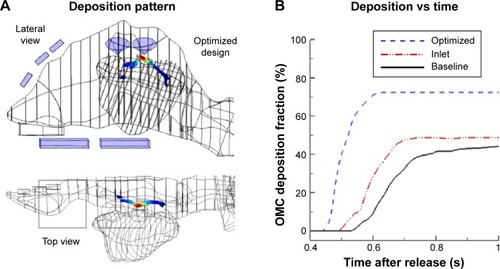
Figure 9 Deposition with optimized design.
Notes: (A) Particle deposition pattern, and (B) time evolution of OMC depositions.
Abbreviations: OMC, ostiomeatal complex; s, seconds.