Figures & data
Figure 1 Schematic illustration of the engineering of STP-NEs: the acidolytic route of STP and approach for bioavailability enhancement via nanoemulsions.
Abbreviations: STP, stiripentol; STP-NEs, stiripentol-loaded nanoemulsions.
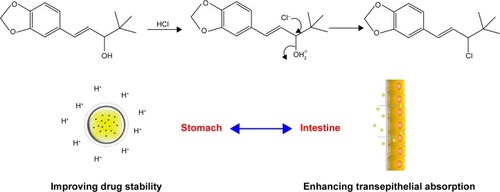
Figure 2 Formulation screening.
Notes: The effect of ratios of PM/MCT (A) and drug/excipients (B) on particle size of STP-NEs.
Abbreviations: PDI, polydispersity index; PM/MCT, poly(ethylene glycol) monooleate/medium-chain triglycerides; STP-NEs, stiripentol-loaded nanoemulsions.
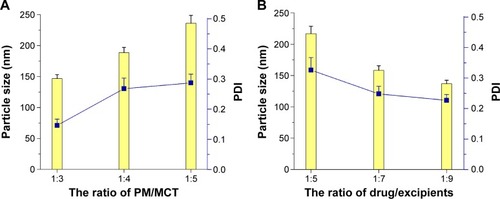
Figure 3 Characterization of STP-NEs.
Notes: (A) size distribution, (B) appearance, and (C) morphology observed by TEM.
Abbreviations: STP-NEs, stiripentol-loaded nanoemulsions; TEM, transmission electron microscopy.
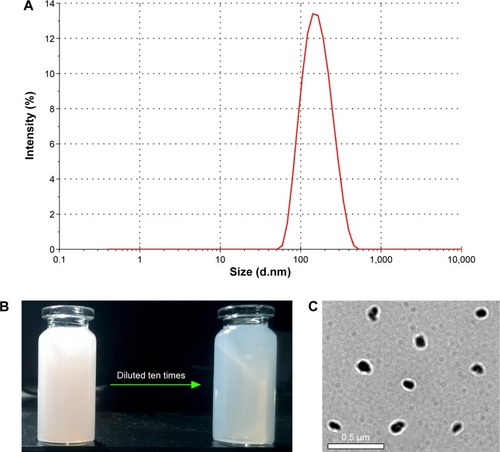
Figure 4 Acidic destabilization curves of free STP and STP-NEs in simulated gastric fluid indicated by the retained percentage of STP (n=3, mean ± SD).
Abbreviations: SD, standard deviation; STP, stiripentol; STP-NEs, stiripentol-loaded nanoemulsions.
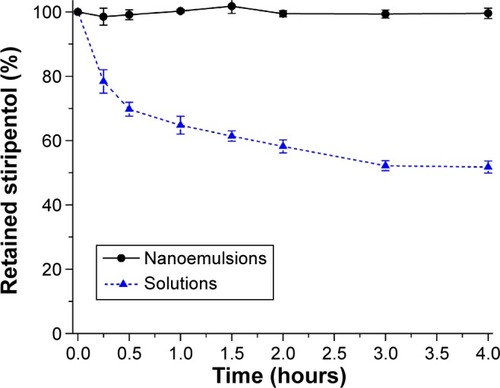
Figure 5 The release profiles of STP from nanoemulsions performed in pH 6.8 phosphate buffer and 0.1 M HCl based on a dialysis method (n=3, mean ± SD).
Abbreviations: SD, standard deviation; STP, stiripentol; STP-NEs, stiripentol-loaded nanoemulsions.
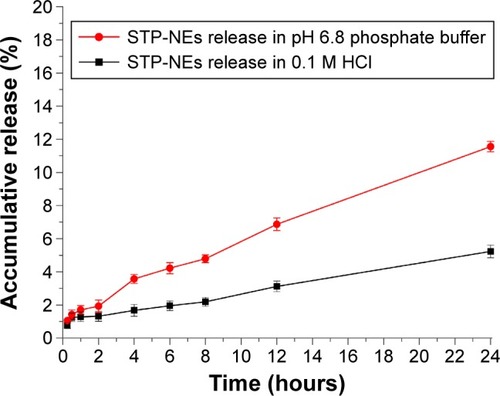
Figure 6 The stability of STP-NEs characterized by particle size as well as polydispersity index (PDI) for a short-term investigation (30 days).
Abbreviation: STP-NEs, stiripentol-loaded nanoemulsions.
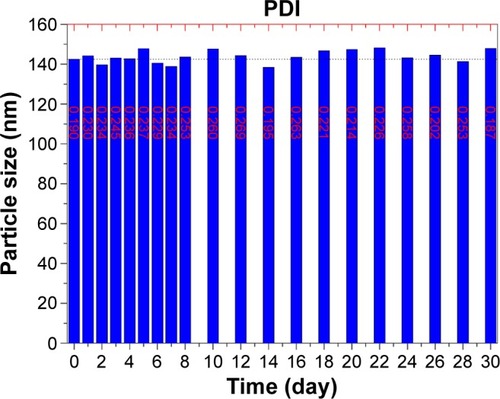
Table 1 Main pharmacokinetic parameters of STP in Sprague Dawley rats after oral administration of commercial formulation (Diacomit®) and STP-NEs
Figure 7 The plasma STP concentration versus time profiles in rats following oral administration of commercial formulation of STP and STP-NEs (n=6, mean ± SD).
Abbreviations: SD, standard deviation; STP, stiripentol; STP-NEs, stiripentol-loaded nanoemulsions.
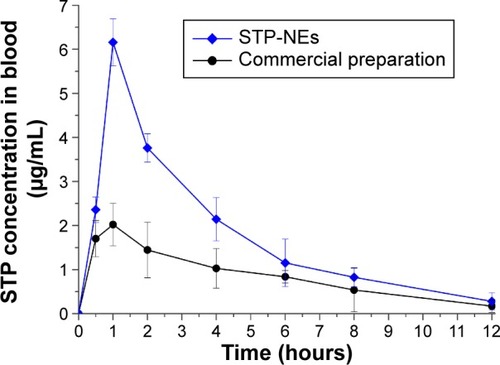
Table 2 The effective intestinal permeability (Peff) of STP and STP-NEs evaluated by the in situ single-pass intestinal perfusion (n=3)
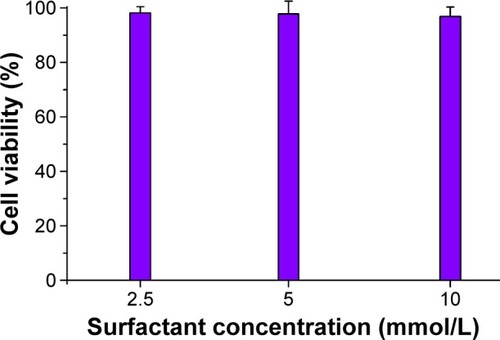
Figure 8 The relative cell viability of Caco-2 incubated with nanoemulsions at different PM concentrations (n=3, mean ± SD).
Abbreviations: PM, poly(ethylene glycol) monooleate; SD, standard deviation.