Figures & data
Figure 1 Surface nanostructured at 10 V (A), 20 V (C), and 30 V (E); histograms of 10 V (B), 20 V (D), and 30 V (F) nanotube diameters.
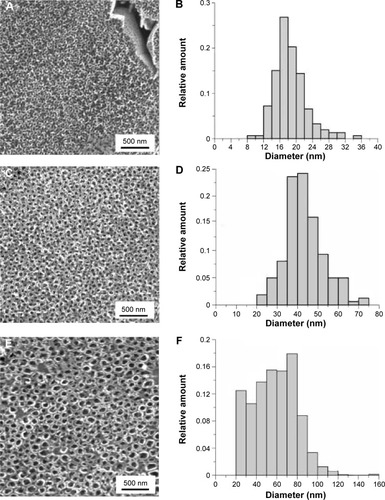
Figure 2 Scanning electron microscopy images of 10 V, 20 V, and 30 V samples with Saos-2 cells on day 3 after seeding.
Notes: Scale bar 1 μm (A, B), scale bar 500 nm (C). Vega3 scanning electron microscope (Tescan).
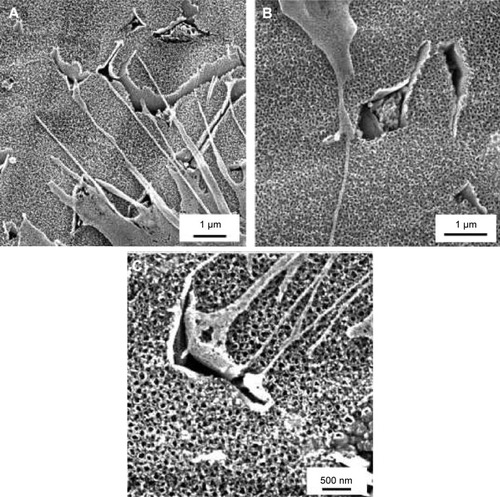
Table 1 Surface composition (%wt) evaluated by X-ray photo electron spectroscopy
Figure 3 X-ray photoelectron spectra of Ti 2p (A), Al 2p (B), and V 2p3/2 (C) on nanostructured surface.
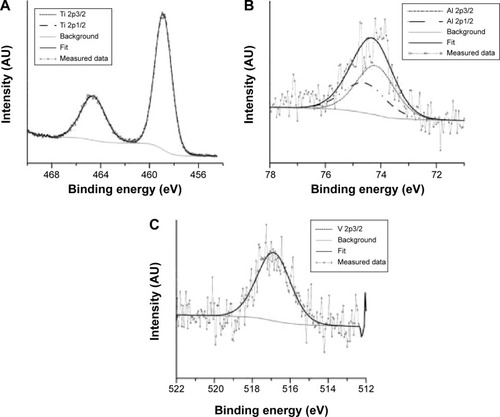
Figure 4 Change in C 1s (A) and F 1s (B) X-ray photoelectron spectra after etching.
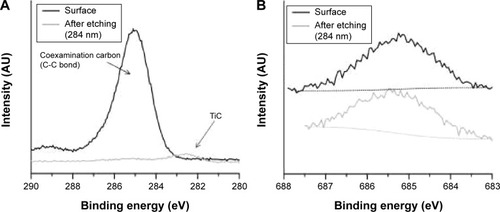
Figure 5 Densities and viability of human Saos-2 osteoblasts on 10 V, 20 V, and 30 V nanotubes.
Notes: Control Ti_C and glass coverslips on days 1 (A), 3 (B), 7 (C), and cell growth curves on these surfaces (D). Data expressed as mean ± standard error of mean from six measurements. P≤0.05 considered significant in comparison with samples labeled above columns.
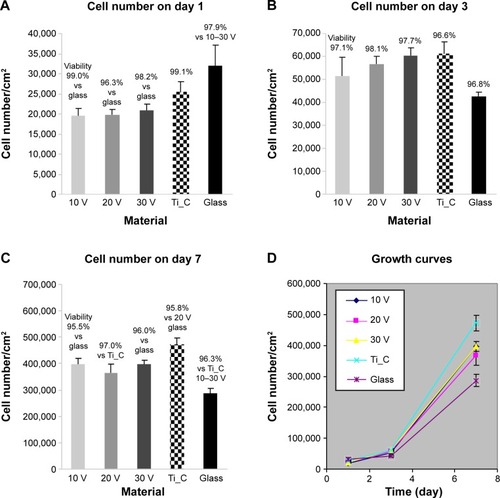
Figure 6 Immunofluorescence staining of vinculin (green) and F-actin (red) in human Saos-2 osteoblasts.
Notes: 10 V (A), 20 V (B), and 30 V (C) nanotubes, on control Ti_C (D), and on glass coverslips (E) on day 3. Cell nuclei (blue) were counterstained with Hoechst 33258. Leica SPE confocal microscope, objective 63×, zoom 2×, scale 25 μm.
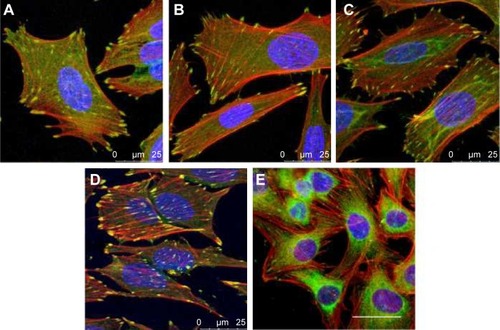
Figure 7 Human Saos-2 osteoblasts on 10 V, 20 V, and 30 V nanotubes, on control Ti_C, and on glass coverslips on day 3.
Notes: Immunofluorescence intensity (A, B) and absorbance measured by enzyme-linked immunosorbent assay (C, D) of talin (A, C) and vinculin (B, D). Data expressed as mean ± standard error of mean. P≤0.05 considered significant in comparison with samples labeled above columns.
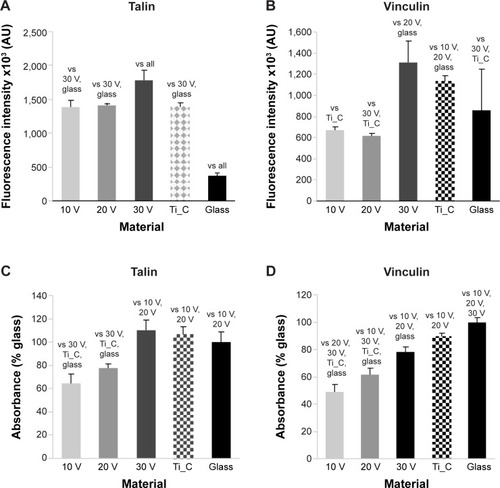
Figure 8 Human Saos-2 osteoblasts on 10 V, 20 V, and 30 V nanotubes, on control Ti_C, and on glass coverslips on day 7.
Notes: Immunofluorescence intensity of collagen (A), ALP (B), osteopontin (C), and osteocalcin (D). Data expressed as means ± standard error of mean. P≤0.05 considered significant in comparison with samples labeled above columns.
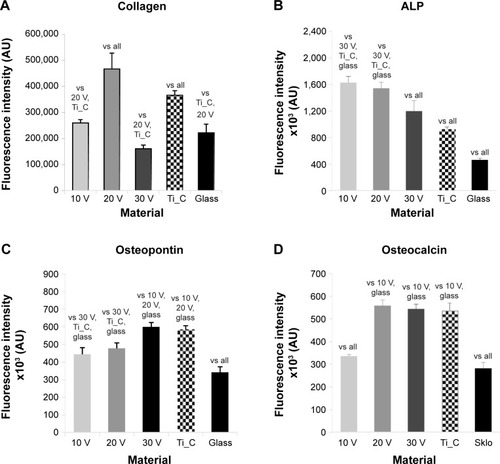
Figure 9 Human Saos-2 osteoblasts on 10 V, 20 V, and 30 V nanotubes, on control Ti_C, and on glass coverslips.
Notes: Absorbance of collagen type I (A), ALP (B), osteopontin (C), osteocalcin (D), and calcium content (E). Measured by enzyme-linked immunosorbent assay (A–D) and by Alizarin staining (E) on day 7. Data expressed as mean ± standard error of mean. P≤0.05 considered significant in comparison with samples labeled above columns.
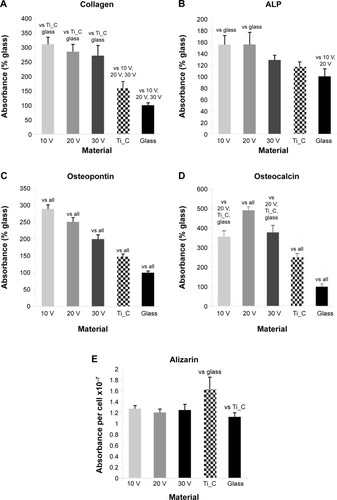
Figure S1 The immunofluorescence staining of talin and staining of F-actin with phalloidin in human Saos-2 osteoblasts.
Notes: On 10 V (A), 20 V (B), and 30 V (C) nanotubes, on control Ti_C (D), and on glass coverslips (E) on day 3. Olympus IX71 epifluorescence microscope, IX71 digital camera, objective 100×, oil immersion. Cell nuclei (blue) were counterstained with Hoechst 33258.
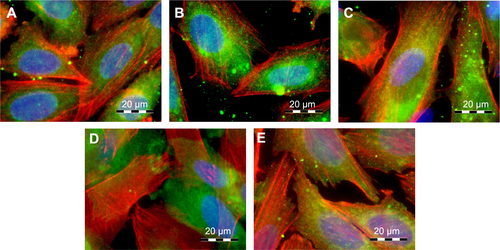
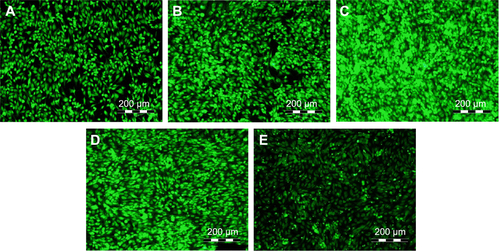
Figure S2 Immunofluorescence staining of collagen in human Saos-2 osteoblasts.
Notes: On 10 V (A), 20 V (B), and 30 V (C) nanotubes, on control Ti_C (D), and on glass coverslips (E) on day 3. Olympus IX71 epifluorescence microscope, IX71 digital camera, objective 20×, bar 100 μm. Cell nuclei (blue) were counterstained with Hoechst 33258.
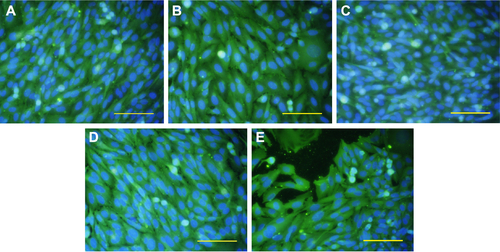
Figure S3 The immunofluorescence staining of ALP in human Saos-2 osteoblasts.
Notes: On 10 V (A), 20 V (B), and 30 V (C) nanotubes, on control Ti_C (D), and on glass coverslips (E) on day 3. Olympus IX71 epifluorescence microscope, IX71 digital camera, objective 20×, bar 100 μm. Cell nuclei (blue) were counterstained with Hoechst 33258.
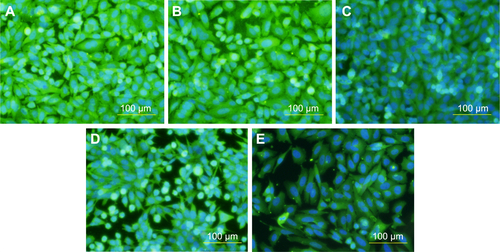
Figure S4 Immunofluorescence staining of osteopontin in human Saos-2 osteoblasts.
Notes: On 10 V (A), 20 V (B), and 30 V (C) nanotubes, on control Ti_C (D), and on glass coverslips (E) on day 3. Olympus IX71 epifluorescence microscope, IX71 digital camera, objective 20×, bar 100 μm. Cell nuclei (blue) were counterstained with Hoechst 33258.
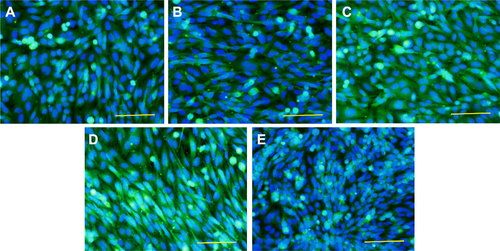
Figure S5 Immunofluorescence staining of osteocalcin in human Saos-2 osteoblasts.
Notes: On 10 V (A), 20 V (B), and 30 V (C) nanotubes, on control Ti_C (D), and on glass coverslips (E) on day 3. Olympus IX71 epifluorescence microscope, IX71 digital camera, objective 20×, bar 200 μm.