Figures & data
Table 1 Recovery, loading, size, PDI, and zeta potential of SMA micelles
Figure 1 Release rate of epirubicin from SMA-Epi micelles.
Notes: (A) Release of epirubicin from 7.5% SMA-Epi and 18% SMA-Epi was assessed over a period of 8 hours at pH 7.4. Data are expressed as mean ± SEM (n=4). (B) Release of epirubicin from 18% SMA-Epi at pH 7.4 and in SGF pH 1.6 over a period of 4 hours incubation. Data expressed as mean ± SEM (n=4).
Abbreviations: Epi, epirubicin; SEM, standard error of the mean; SGF, simulated gastric fluid; SMA, styrene maleic acid.
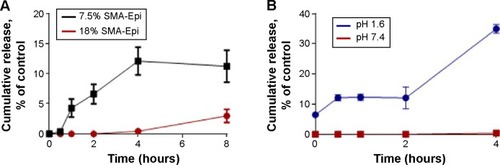
Figure 2 Cytotoxicity of SMA micelles against MDA-MB-231 cells following 72 hours of treatment.
Notes: Cell number was determined using the sulforhodamine B assay. Data are expressed as mean ± SEM (n=3). IC50 values determination was performed using GraphPad Prism.
Abbreviations: IC50, half-maximal inhibitory concentration; SEM, standard error of the mean; SMA, styrene maleic acid.
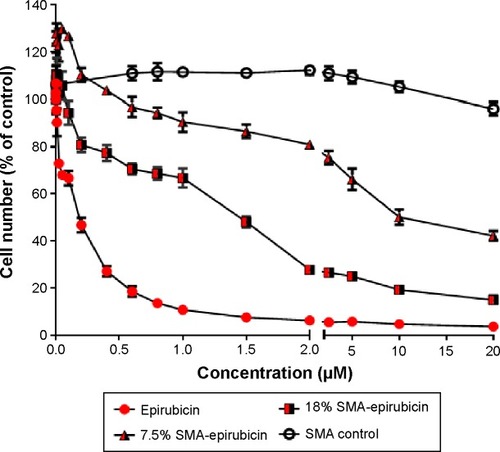
Figure 3 Transport of SMA-Epi Micelles across an in vitro model of intestinal epithelium.
Notes: (A) The transport of 7.5% SMA-Epi and 18% SMA-Epi across an in vitro model of intestinal epithelium after 3 hours of treatment. (B) Clathrin, caveolin, E-cadherin (marker for differentiated Caco-2 cells), and β-tubulin (loading control) expression in differentiated and undifferentiated Caco-2 cells by western blotting. (C) Transport of SMA micelles across differentiated Caco-2 monolayer after 1-hour pretreatment with caveolin inhibitor, clathrin inhibitor, micropinocytosis inhibitor, and without any inhibitor, followed by 3-hour incubation with 18% SMA-Epi. Data are expressed as mean ± SEM (n=4). *P<0.05.
Abbreviations: Epi, epirubicin; SEM, standard error of the mean; SMA, styrene maleic acid; ns, not significant.
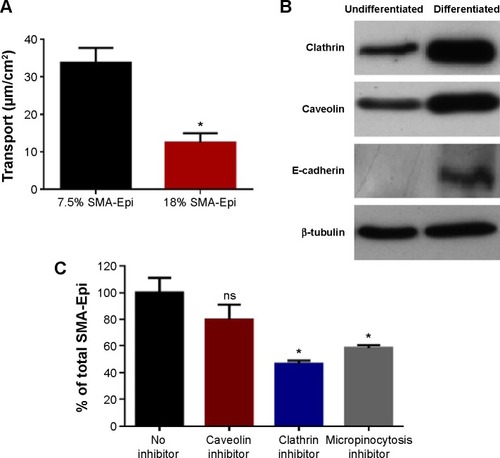
Figure 4 Transport of SMA-Epi micelles across an ex vivo model of intestinal epithelium.
Notes: (A) Transport of 7.5% SMA-Epi through ileum and jejunum, and 18% SMA-Epi though ileum and jejunum, after 3 hours of treatment. Data are expressed as mean ± SEM (n=5). *P<0.05. (B) The intestinal tissue histology post–everted sac experiment was observed by Hematoxylin QS staining.
Abbreviations: Epi, epirubicin; SEM, standard error of the mean; SMA, styrene maleic acid.
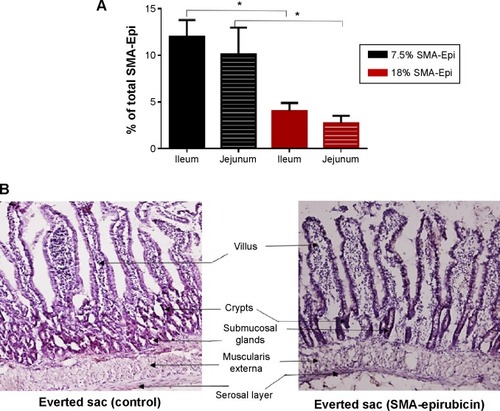
Figure 5 In vivo oral biodistribution of SMA-DiI.
Notes: (A) Sections of organs from mice following oral administration of SMA-DiI and free DiI and intravenous administration of SMA-DiI were all stained with Hematoxylin QS and observed under a fluorescence microscope. The black scale bar indicates 50 µm on all sections. (B) The distribution of SMA micelles and free dye across different organs was obtained by measuring the total fluorescence intensity of DiI. Data are expressed as mean ± SEM (n=10). *P<0.05.
Abbreviations: DiI, dioctadecyl-3,3,3′,3′-tetramethylindocarbocyanine perchlorate; IV, intravenous; SEM, standard error of the mean; SMA, styrene maleic acid.
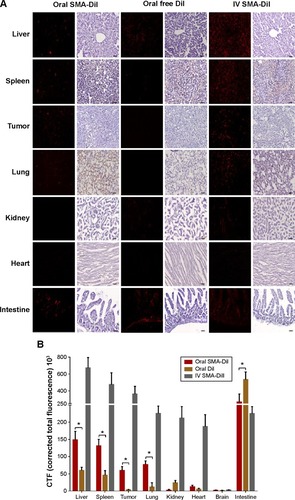
Figure 6 Histochemistry of intestinal sections.
Note: UEA-1 staining for M-cells and DiI fluorescence in the intestinal villi sections (20×), obtained from mice following oral gavage with SMA-DiI for 4 hours.
Abbreviations: DiI, dioctadecyl-3,3,3′,3′-tetramethylindocarbocyanine perchlorate; M-cell, microfold cell; SMA, styrene maleic acid; UEA-1, biotin conjugated lectin from Ulex europaeus agglutinin.
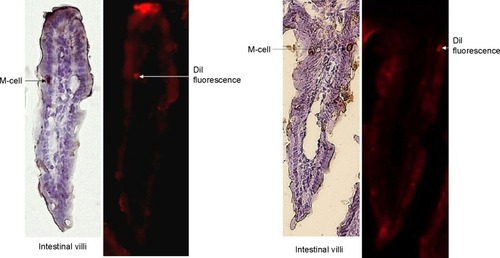
Figure 7 Histochemistry of Peyer’s patches.
Note: Peyer’s patches isolated from ileum sections of the intestine, obtained from mice following oral gavage with SMA-DiI for 4 hours, where H&E stained and observed under a fluorescence microscope.
Abbreviations: DiI, dioctadecyl-3,3,3′,3′-tetramethylindocarbocyanine perchlorate; H&E, hematoxylin and eosin; SMA, styrene maleic acid.
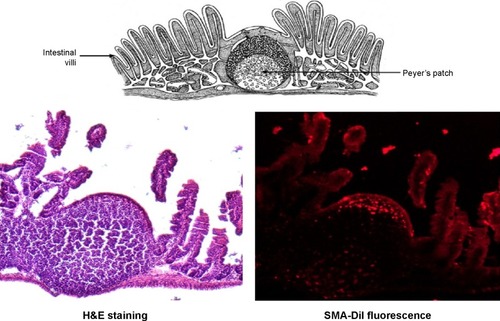
Figure S1 Size distribution of 7.5% SMA-Epi was determined by TEM at concentration of 1 mg/mL in water with 1% phosphotungstic acid for staining.
Notes: Boxes indicate a single SMA micellar particle. The size of 7.5% SMA-Epi by TEM is calculated as the average of the four particles labeled in the figure.
Abbreviations: Epi, epirubicin; SMA, styrene maleic acid; TEM, transmission electron microscope.
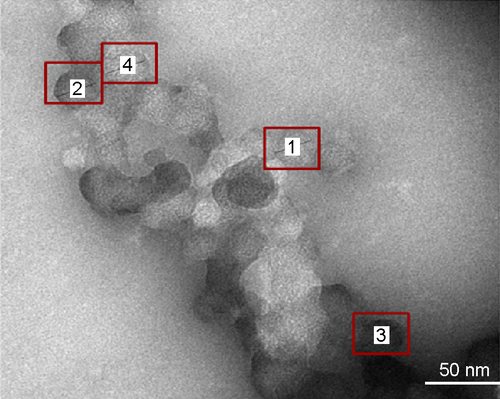
Figure S2 The particle size distribution in the media from the lower compartment after a 3-hour incubation with 18% SMA-Epi micelles (green) and 18% SMA-Epi micelle in 0.1 M NaHCO3 (red) was determined using a Malvern Zetasizer.
Abbreviations: Epi, epirubicin; SMA, styrene maleic acid.

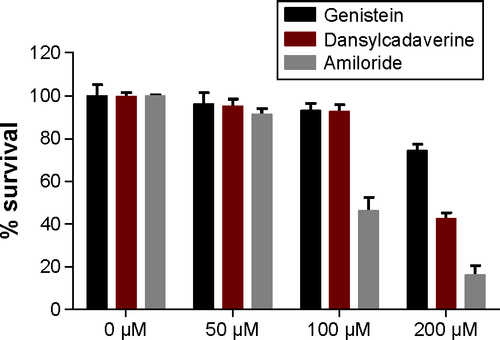
Figure S3 Cytotoxicity of endocytosis inhibitors against Caco-2 cells, evaluated through MTT assay. The cytotoxicity of endocytosis inhibitors was assessed over 4 hours using MTT assay. Data expressed as mean ± SEM (n=4).
Abbreviations: MTT, (3-(4,5-dimethylthiazolyl-2)-2,5-diphenyltetrazolium bromide); SEM, standard error of the mean.