Figures & data
Table 1 The hydrodynamic size and zeta potential of the TNPs in ultrapure water and RPMI 1640 culture media by DLS analysis
Figure 1 Characterization of TNPs by TEM.
Notes: Particle shape was analyzed by TEM (A) and the size distribution in the test media were evaluated by ImageJ software (B).
Abbreviations: TNPs, titanium dioxide nanoparticles; TEM, transmission electron microscope.
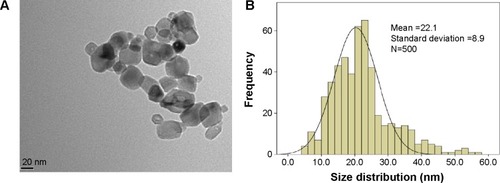
Figure 2 Cell viability of A549 cells was measured by MTT assay after 24 hours TNP exposure.
Notes: Cell viability was significantly decreased in a dose-dependent manner after TNP treatment. *P<0.05, compared with control group, n=5.
Abbreviations: MTT, 3-(4,5-dimethyl-2-thiazolyl)-2,5-diphenyl-2-H-tetrazolium bromide; TNP, titanium dioxide nanoparticle.
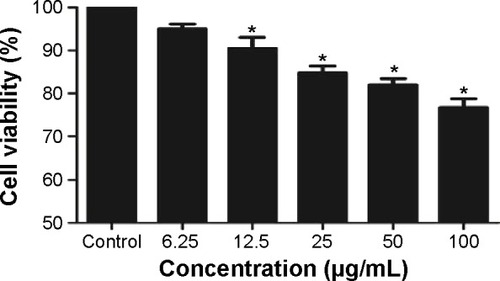
Figure 3 LDH activity was detected in TNP-treated A549 cells.
Notes: After cells were exposed to TNPs (0 μg/mL, 6.25 μg/mL, 12.5 μg/mL, 25 μg/mL, 50 μg/mL, and 100 μg/mL) for 24 hours, the supernatants were determined using a commercial LDH kit according to the manufacturer’s protocols. *P<0.05, compared with control group, n=5.
Abbreviations: LDH, lactate dehydrogenase; TNPs, titanium dioxide nanoparticles.
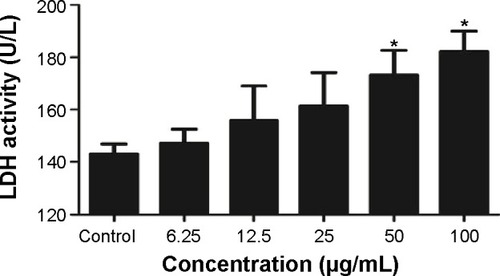
Figure 4 Effects of TNPs on intracellular ROS generation in A549 cells.
Notes: The typical picture of ROS detected by flow cytometry (A); the intracellular ROS level significantly increased in a dose-dependent manner (B). Data are expressed as mean ± SD. n=5, *P<0.05, compared with control.
Abbreviations: FITC, fluorescein isothiocyanate; TNPs, titanium dioxide nanoparticles; ROS, reactive oxygen species; SD, standard deviation.
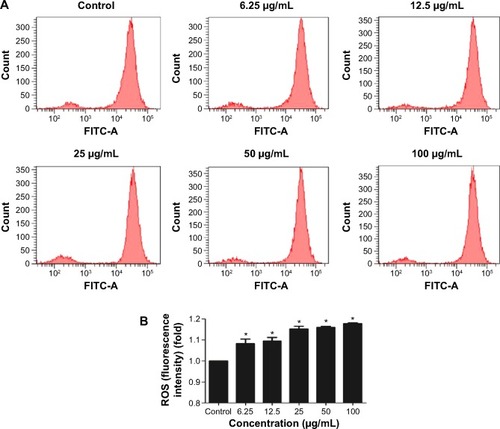
Figure 5 Effects of inhibitors, 5-aza or α-LA, on TNP-induced ROS generation in A549 cells.
Notes: The methyltransferase inhibitor, 5-aza decreased TNPs-induced ROS generation (A); the antioxidant agent, α-LA suppressed ROS generation triggered by TNPs (B). Data are expressed as mean ± SD; n=5, *P<0.05, compared with control; #P<0.05, compared with TNPs.
Abbreviations: 5-aza, 5-aza-2′-deoxycytidine; α-LA, α-lipoic acid; TNPs, titanium dioxide nanoparticles; ROS, reactive oxygen species; SD, standard deviation.
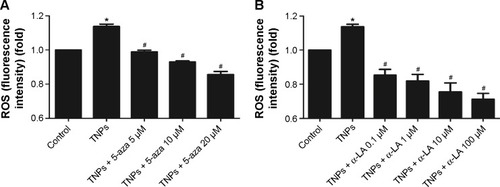
Figure 6 TNPs induced the alternation of PARP-1 methylation status.
Notes: A549 cells were exposed to various concentrations (6.25 μg/mL, 12.5 μg/mL, 25 μg/mL, 50 μg/mL, and 100 μg/mL) of TNPs for 24 hours, methylation-specific PCR was performed to examine the methylation status of PARP-1. U and M: primer sets specific to unmethylated (U) and methylated (M) DNA molecules. The data were typical examples of five independent experiments. *P<0.05, compared with control.
Abbreviations: TNPs, titanium dioxide nanoparticles; PARP-1, poly(ADP-ribose) polymerase 1; PCR, polymerase chain reaction.
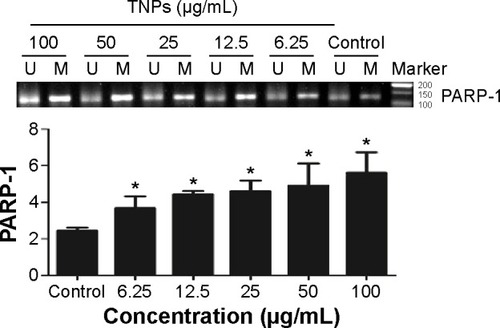
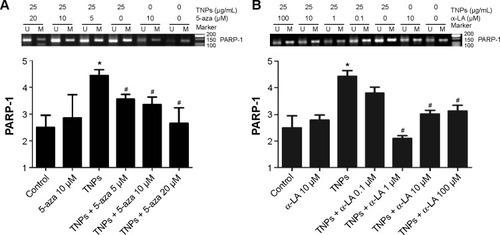
Figure 7 Effects of inhibitors, 5-aza or α-LA, on TNP-induced methylation of PARP-1 by MSP in A549 cells.
Notes: Treatment with methyltransferase inhibitor, 5-aza (A); treatment with antioxidant agent, α-LA (B). U and M: primer sets specific to unmethylated (U) and methylated (M) DNA molecules. The data were typical examples of five independent experiments. *P<0.05, compared with control; #P<0.05, compared with TNPs.
Abbreviations: 5-aza, 5-aza-2′-deoxycytidine; α-LA, α-lipoic acid; TNPs, titanium dioxide nanoparticles; PARP-1, poly(ADP-ribose) polymerase 1; MSP, methylation-specific PCR; PCR, polymerase chain reaction.