Figures & data
Figure 1 The cytotoxic effects of Phenol (positive control), CS and CS/SIM/PLGA bone grafts.
Notes: D1 cells were treated with extraction medium obtained from the bone grafts. LDH leakage was analyzed to evaluate cell cytotoxicity. The values are shown as the mean ± standard error of the mean, n=4. ***P<0.001 compared with control group.
Abbreviations: CS, calcium sulfate; SIM, simvastatin; PLGA, poly(lactic-co-glycolic acid) microspheres; LDH, lactate dehydrogenase.
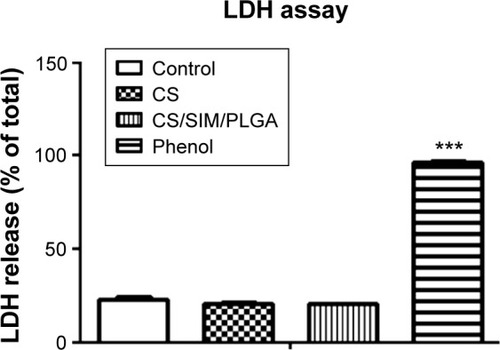
Figure 2 Cell adherent effect of D1 cells seeded on PVC (negative control), CS, and CS/SIM/PLGA bone grafts.
Notes: The values are shown as the mean ± standard error of the mean, n=3. ***P<0.001 compared with the PVC group.
Abbreviations: PVC, polyvinyl chloride; CS, calcium sulfate; SIM, simvastatin; PLGA, poly(lactic-co-glycolic acid) microspheres.
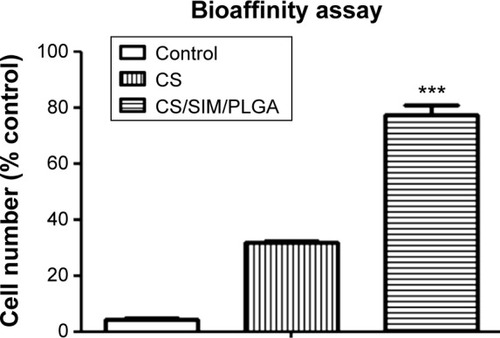
Figure 3 Histological specimens from calvarial defects 8 weeks after implantation of bone graft substitutes with hematoxylin-eosin staining.
Note: Calvarial defects implanted without bone graft substitutes were used as controls.
Abbreviations: CS, calcium sulfate; SIM, simvastatin; PLGA, poly(lactic-co-glycolic acid) microspheres.
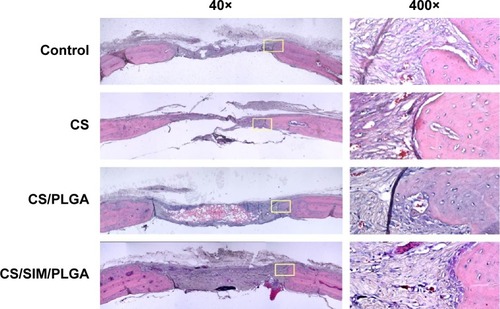
Figure 4 Histological specimens from calvarial defects 10 weeks after implantation of bone graft substitutes with hematoxylin-eosin staining.
Note: Calvarial defects implanted without bone graft substitutes were used as controls.
Abbreviations: CS, calcium sulfate; SIM, simvastatin; PLGA, poly(lactic-co-glycolic acid) microspheres.
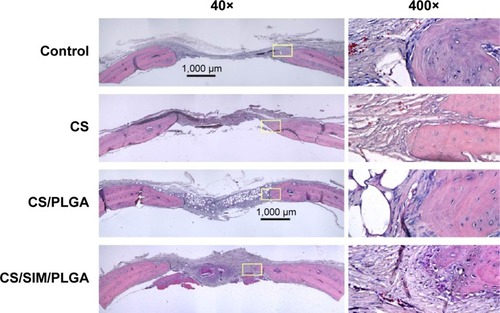
Figure 5 Histological specimens from calvarial defects after 12 weeks of implantation of bone graft substitutes with hematoxylin-eosin staining.
Note: Calvarial defects implanted without bone graft substitutes were used as controls.
Abbreviations: CS, calcium sulfate; SIM, simvastatin; PLGA, poly(lactic-co-glycolic acid) microspheres.
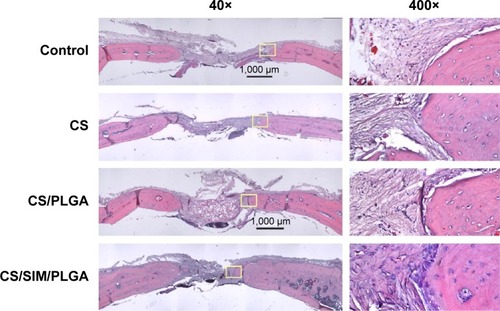
Figure 6 Histological quantification study of new bone matrix formation at 8, 10, and 12 weeks after implantation of bone graft substitutes.
Note: **P<0.0001 compared with controls and between treatment groups, respectively.
Abbreviations: CS, calcium sulfate; SIM, simvastatin; PLGA, poly(lactic-co-glycolic acid) microspheres.
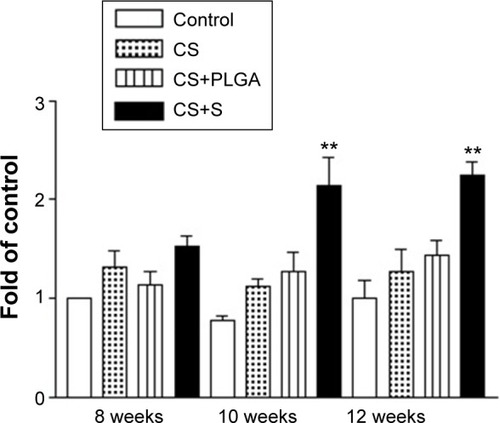
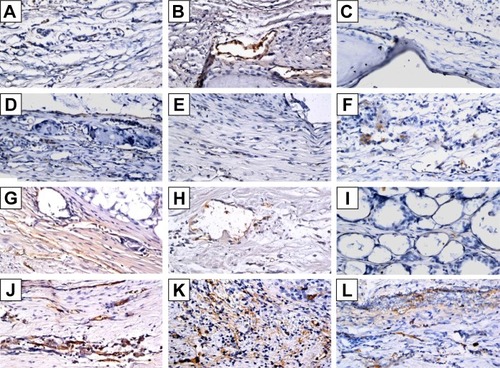
Figure 7 Immunohistochemistry analysis of bone morphogenetic protein-2 expression in calvarial defects 8, 10, and 12 weeks after implantation of bone graft substitutes.
Notes: Calvarial defects implanted without bone graft substitutes were used as controls. (A–L) Higher magnification of the rectangle inset areas are shown as .
Abbreviations: CS, calcium sulfate; SIM, simvastatin; PLGA, poly(lactic-co-glycolic acid) microspheres.
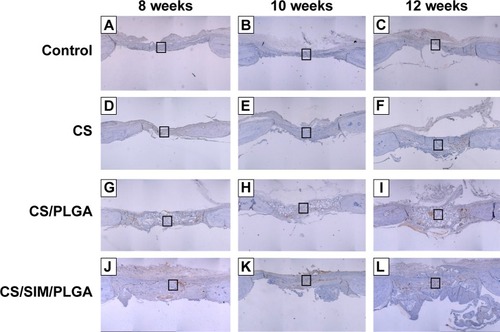
Figure 8 Immunohistochemistry analysis of bone morphogenetic protein-2 expression in calvarial defects at 8, 10, and 12 weeks after implantation of bone graft substitutes.
Notes: Calvarial defects implanted without bone graft substitutes were used as controls. A–L show the higher magnification of the rectangle inset areas in . Control group (A–C); CS group (D–F); CS/PLGA group (G–I); CS/SIM/PLGA group (J–L).
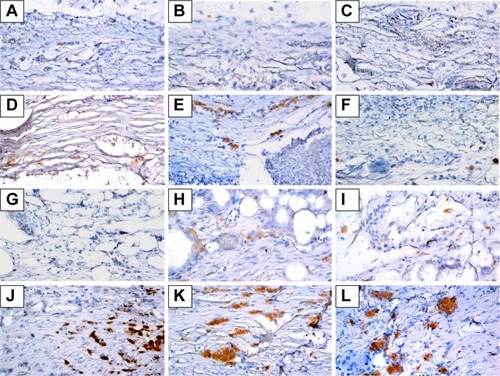
Figure 9 Immunochemistry analysis of von Willebrand factor expression in calvarial defects at 8, 10, and 12 weeks after implantation of bone graft substitutes.
Notes: Calvarial defects implanted without bone graft substitutes were used as controls. (A–L) Higher magnification of the rectangle inset areas are shown as .
Abbreviations: CS, calcium sulfate; SIM, simvastatin; PLGA, poly(lactic-co-glycolic acid) microspheres.
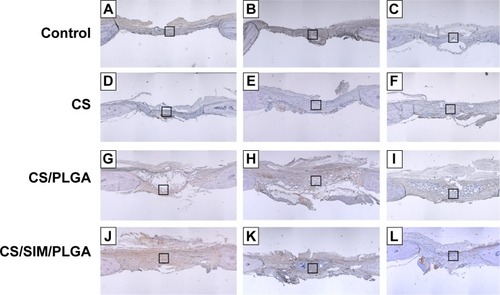
Figure 10 Immunohistochemistry analysis of von Willebrand factor expression in calvarial defects at 8, 10, and 12 weeks after implantation of bone graft substitutes.
Notes: Calvarial defects implanted without bone graft substitutes were used as controls (magnification 400×). A–L show the higher magnification of the rectangle inset areas in . Control group (A–C); CS group (D–F); CS/PLGA group (G–I); CS/SIM/PLGA group (J–L).