Figures & data
Figure 1 Synthesis of dual imaging silica nanoparticles.
Abbreviations: Gd, gadolinium; NHS, N-hydroxysuccinate; PEG, poly(ethylene glycol); PEI, polyethylenimine; TPS, trimethoxy(3-[oxiran-2-ylmethoxy]propyl)silane.
![Figure 1 Synthesis of dual imaging silica nanoparticles.Abbreviations: Gd, gadolinium; NHS, N-hydroxysuccinate; PEG, poly(ethylene glycol); PEI, polyethylenimine; TPS, trimethoxy(3-[oxiran-2-ylmethoxy]propyl)silane.](/cms/asset/58c240b7-533a-4e7b-8fe3-0cad9329a3cf/dijn_a_88311_f0001_c.jpg)
Figure 2 (A) Particle size distribution (by dynamic light scattering) and (B) morphological analysis (by transmission electron microscopy) of Gd silica nanoparticles, (C) energy-dispersive spectroscopic elemental analysis, and the corresponding elemental mapping of Si (D) and Gd (E).
Abbreviations: Si, silica; Gd, gadolinium.
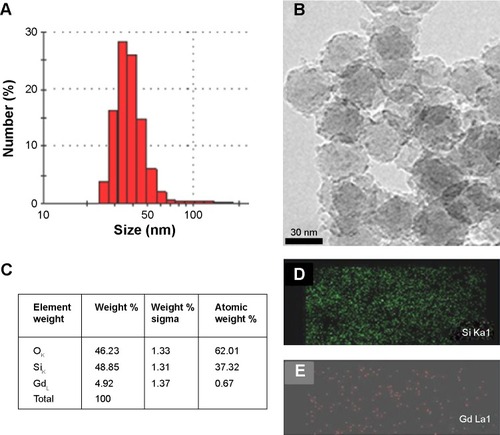
Figure 3 (A–C) Feasibility of cell transfection in A549 lung cancer cells in fluorescent imaging mode using gadolinium-conjugated silica nanoparticles (0.2 mg/mL).
Notes: (A) Nuclei stained by 4,6-diamidino-2-phenylindole (blue), (B) dual imaging silica nanoparticles represents red fluorescence (rhodamine isothiocyanate dye). (C) Merged fluorescence microscopic image of dual imaging silica nanoparticles transfected in A549 lung cancer cells. Gadolinium-conjugated silica nanoparticles in colloidal solution using T1-weighted magnetic resonance imaging (D) and fluorescent imaging mode (E).
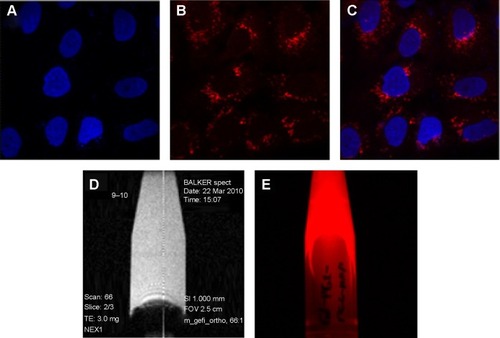
Figure 4 (A, B) Relaxation (r1) rates with different concentrations of dual imaging silica nanoparticles and (C, D) T1-weighted images using a 9.4 T micro-imaging analyzer instrument. Colloidal solution of dual imaging silica nanoparticles in water (C) and a pure water sample (D).
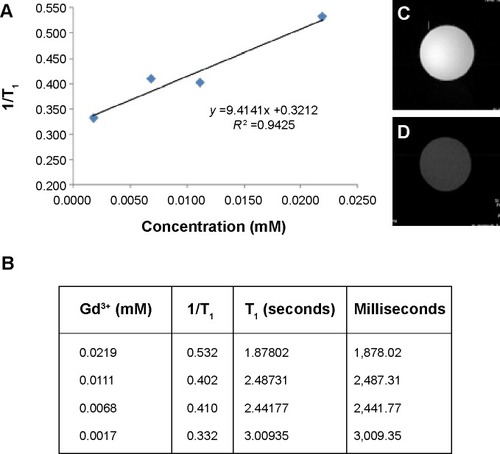
Figure 5 Distribution of gadolinium to the organs in an in vivo mouse model. The upper panel shows organ-dependent inductively coupled plasma mass spectrometry data 6 hours after injection. The lower panel shows the corresponding data at 1 hour and 6 hours after injection.
Abbreviations: IP, Intraperitoneal; Gd, gadolinium.
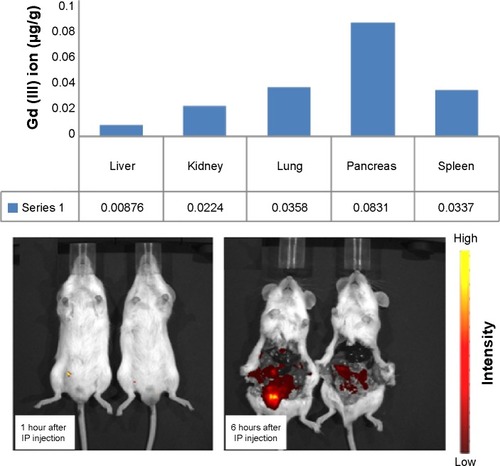
Figure S1 Solid-state NMR analysis of 400 MHz 29Si, 13C CP MAS NMR spectrum. 29Si CP MAS NMR spectrum and 600 MHz 1H-NMR spectrum.
Notes: 29Si CP MAS NMR spectrum of aminopropyl functionalized silica nanoparticles and PEI 25-PEG 5k graft silica nanoparticles as well as silica nanoparticles (A), 13C CP MAS NMR spectrum of aminopropyl functionalized silica nanoparticles and PEI 25-PEG 5k graft silica nanoparticles as well as silica nanoparticles (B), 600 MHz 1H-NMR NMR spectrum of PEI 25k, PEG5k as well as PEI 25k-PEG 5k copolymer (C).
Abbreviations: APTES, (3-aminopropyl)triethoxysilane; NP, nanoparticle; PEG, poly(ethylene glycol); PEI, polyethylenimine; ppm, parts per million, NMR, nuclear magnetic resonance.
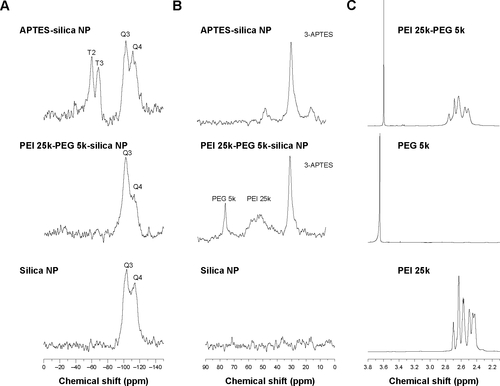
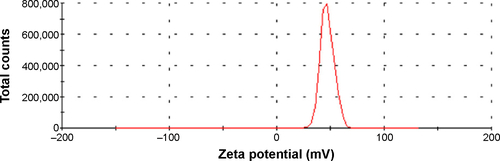
Figure S2 Zeta potential of the dual imaging silica nanoparticles.