Figures & data
Figure 1 Visible absorption spectra for AuNPs without glucosamine and AuNPs functionalized with different concentrations of glucosamine, ie, (F1) 0.021% w/v, (F2) 0.043% w/v, (F3) 0.086% w/v, and (F4) 0.12% w/v.
Abbreviations: au, absorbance unit; AuNPs, gold nanoparticles; F, formulation.
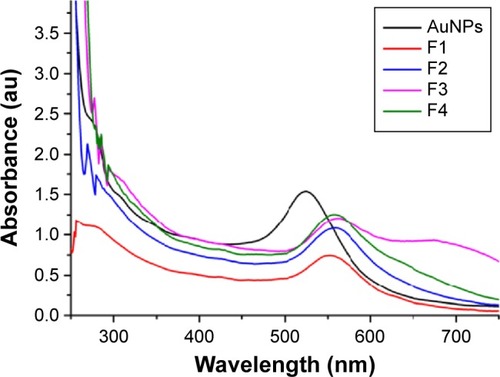
Figure 2 Raman spectra for AuNPs and GlcN-AuNPs.
Abbreviations: AuNPs, gold nanoparticles; GlcN-AuNPs, glucosamine-functionalized gold nanoparticles.
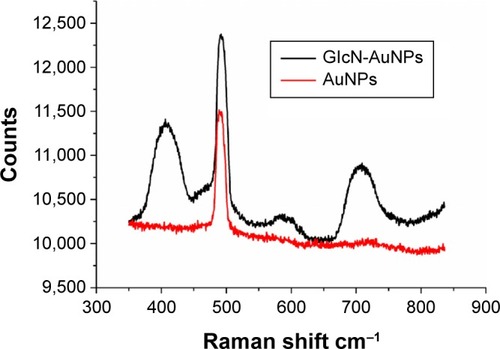
Figure 3 Particle size distribution for AuNPs without glucosamine and AuNPs functionalized with different concentrations of glucosamine, ie, (F1) 0.021% w/v, (F2) 0.043% w/v, (F3) 0.086% w/v, and (F4) 0.12% w/v (n=3).
Abbreviations: AuNPs, gold nanoparticles; GlcN-AuNPs, glucosamine-functionalized gold nanoparticles; PDI, polydispersity index; F, formulation.
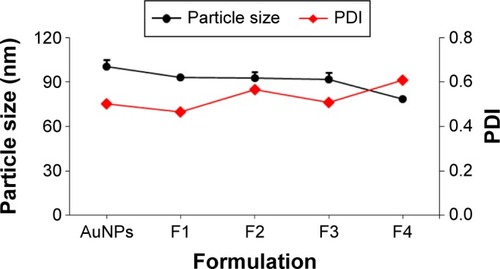
Figure 4 SEM images of AuNPs.
Notes: Scanning electron micrographs of AuNPs without glucosamine (A) and AuNPs functionalized with different concentrations of glucosamine, ie, (B) (F1) 0.021% w/v, (C) (F2) 0.043% w/v, (D) (F3) 0.086% w/v, and (E) (F4) 0.12% w/v of GlcN concentration.
Abbreviations: AuNPs, gold nanoparticles; F, formulation; GlcN, glucosamine.
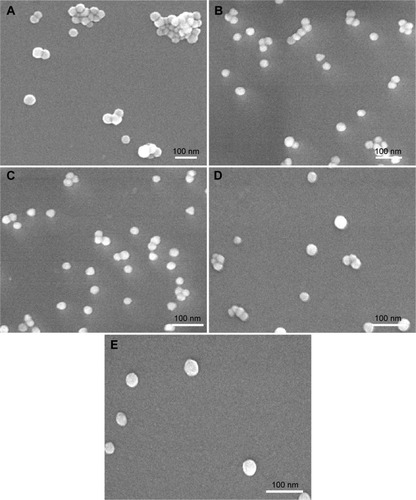
Figure 5 TEM images of AuNPs and GlcN-AuNPs.
Notes: Transmission electron micrographs of (A) AuNPs and (B) glucosamine-functionalized AuNPs showing their particle size distribution and shape. The inset image (B1) indicates the width of a single glucosamine-functionalized nanoparticle.
Abbreviations: AuNPs, gold nanoparticles; GlcN-AuNPs, glucosamine-functionalized gold nanoparticles.
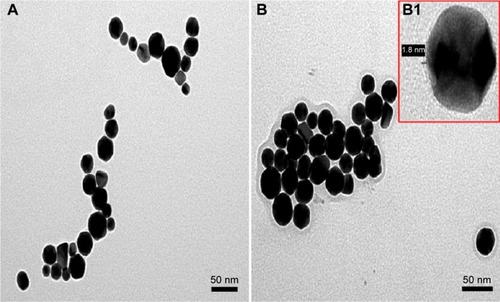
Figure 6 Atomic force micrographs of AuNPs (A, B) and GlcN-AuNPs (C, D).
Notes: (A) and (C) show the particle height and (B) and (D) represent three-dimensional images of the nanoparticles. Both of the formulations showed nanoparticles with a spherical shape.
Abbreviations: AuNPs, gold nanoparticles; GlcN-AuNPs, glucosamine-functionalized gold nanoparticles.
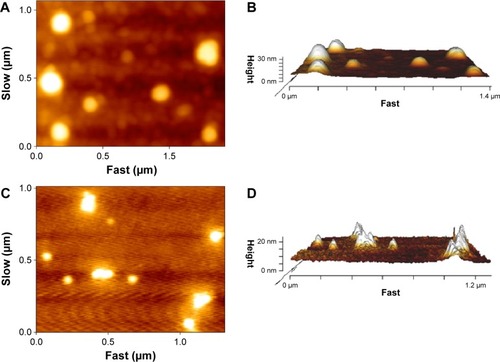
Figure 7 Antibacterial activity of AuNPs, GlcN-AuNPs, ultraviolet light-treated GlcN-AuNPs, laser-treated GlcN-AuNPs, and standard kanamycin.
Notes: A significant difference in activity was observed in all nanoparticle treatment groups when compared with the control (P,0.001). The laser-treated GlcN-AuNPs showed better inhibition of bacterial growth at a low concentration when compared with other nanoparticles. A significant difference was observed between laser-treated GlcN-AuNPs and the other nanoparticles at high concentration (P<0.001).
Abbreviations: AuNPs, gold nanoparticles; GlcN-AuNPs, glucosamine-functionalized gold nanoparticles.
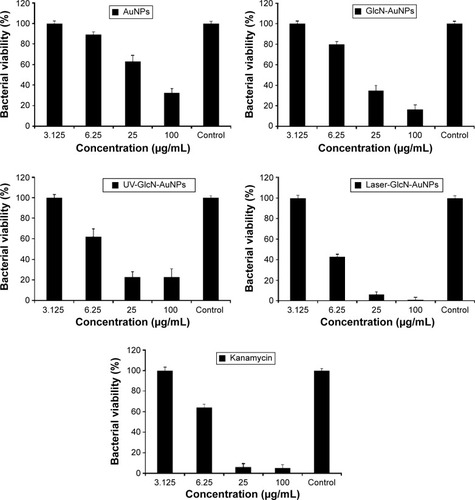
Figure 8 Transmission electron micrographs of Escherichia coli before and after treatment with GlcN-AuNPs.
Notes: (A) Bacteria before treatment with GlcN-AuNPs showing clear and well structured morphology. (B) Bacteria after treatment with GlcN-AuNPs showing damaged cell membranes and ruptured structures. (B1) Inset image shows nanoparticles attached and surrounding E. coli.
Abbreviations: AuNPs, gold nanoparticles; GlcN-AuNPs, glucosamine-functionalized gold nanoparticles.
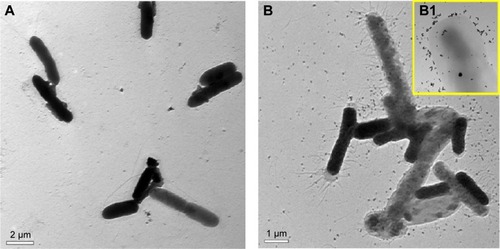
Figure 9 Atomic force micrographs showing time-dependent morphological changes in Escherichia coli before and after treatment with glucosamine-functionalized gold nanoparticles.
Notes: (A) 0 hour, (B) 6 hours, (C) 12 hours, and (D) 24 hours. At 0 hour, no morphological changes were observed. After 24 hours of treatment, the bacterial morphology was changed, and confirmed by the height (refer to y-axis of figures) of the bacteria, which decreased from 300 nm to 140 nm.
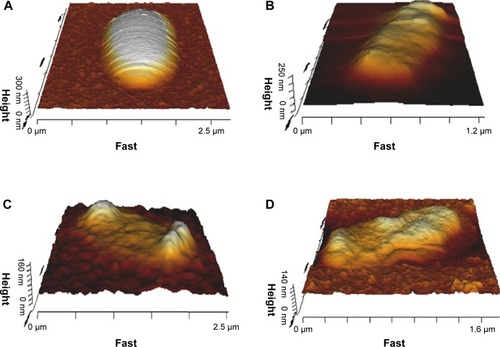
Figure 10 Flow cytometry analysis of Escherichia coli.
Notes: (A) Bacteria treated with medium only as a control, (B) bacteria treated with AuNPs, (C) bacteria treated with GlcN-AuNPs, (D) bacteria treated with ultraviolet-irradiated GlcN-AuNPs, (E) bacteria treated with laser-irradiated GlcN-AuNPs, and (F) bacteria treated with standard kanamycin.
Abbreviations: AuNPs, gold nanoparticles; GlcN-AuNPs, glucosamine-functionalized gold nanoparticles; R, R-region.
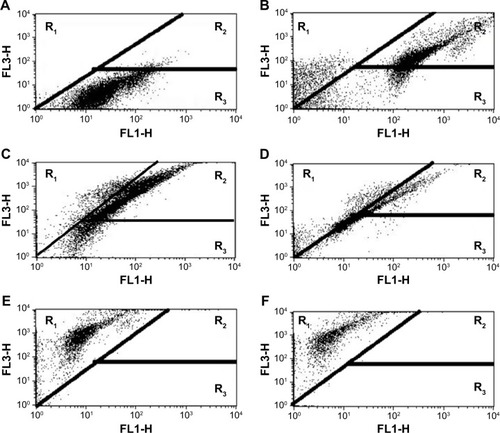
Figure 11 Fluorescence micrographs of Escherichia coli.
Notes: (A) Bacteria treated with medium only as a control, (B) bacteria treated with AuNPs, (C) bacteria treated with GlcN-AuNPs, (D) bacteria treated with ultraviolet-irradiated GlcN-AuNPs, (E) bacteria treated with laser-irradiated GlcN-AuNPs, and (F) bacteria treated with standard kanamycin. Green indicates live bacteria and red indicates dead bacteria.
Abbreviations: AuNPs, gold nanoparticles; GlcN-AuNPs, glucosamine-functionalized gold nanoparticles.
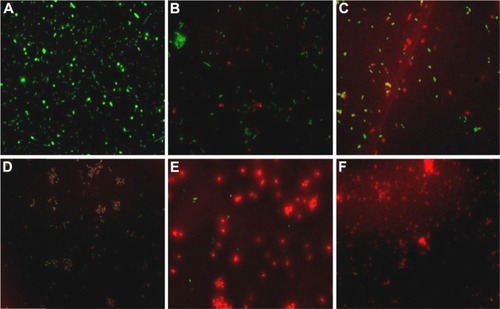
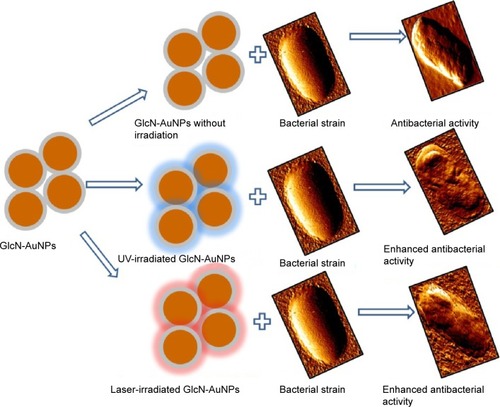
Figure 12 Schematic diagram for antibacterial activity of prepared nanoparticles.
Abbreviations: AuNPs, gold nanoparticles; GlcN-AuNPs, glucosamine-functionalized gold nanoparticles; UV, ultraviolet light.