Figures & data
Figure 1 Effect of formulation variables on size distribution and surface charge of PLGA/Eudragit RL NPs.
Notes: Influence of (A) PVA concentration and (B) organic phase and aqueous phase ratio on the particle diameter and surface charge of PLGA/Eudragit RL (50:50) NPs. Influence of PLGA and Eudragit RL ratio on particle size and surface charge with (C) 0.1% PVA and (D) 1.0% PVA aqueous phase.
Abbreviations: PLGA, poly(lactide-co-glycolide); NP, nanoparticle; PVA, polyvinyl alcohol.
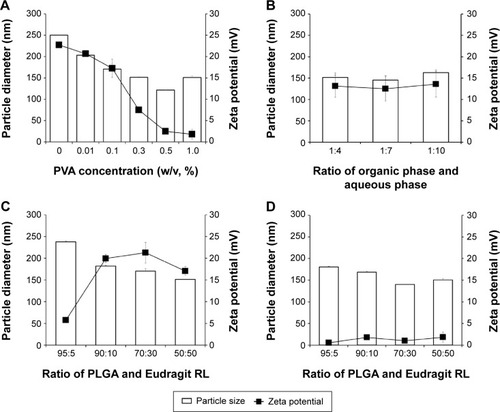
Table 1 Physicochemical characteristic of DiR-loaded PLGA/Eudragit RL NPs
Figure 2 Hyperspectral images of DiR-loaded NPs: (A) the probe mapped, (B) NP mapped, and (C) both the probe and NP mapped (bar =0.5 μm).
Note: The inset in all figures are magnified ×8 that of the image.
Abbreviations: DiR, 1,1′-dioctadecyl-3,3,3′,3′ tetramethylindotricarbocyanine iodide; PLGA, poly(lactide-co-glycolide); NP, nanoparticle.
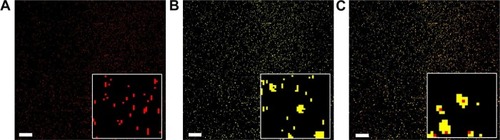
Figure 3 Hyperspectral images of the DiR-loaded NPs/HAs aggregates in aqueous medium (bar =0.5 μm).
Notes: (A) Optical micrograph of the NPs/HAs aggregates, (B) DiR-loaded NPs in the aggregates rendered red using HyperVisual Software, and (C) a merged image of panels (A) and (B).
Abbreviations: DiR, 1,1′-dioctadecyl-3,3,3′,3′ tetramethylindotricarbocyanine iodide; PLGA, poly(lactide-co-glycolide); NP, nanoparticle; HA, hyaluronic acid.
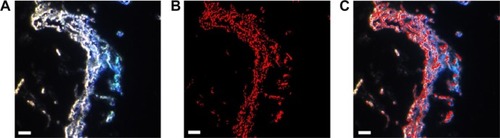
Figure 4 In vitro release of the fluorescent probe from the cationic NPs and NPs/HAs aggregates in 10 mM PBS with 1% (w/v) SLS at 37°C.
Note: Vertical bars represent mean ± SD (n=3).
Abbreviations: NP, nanoparticle; HA, hyaluronic acid; PBS, phosphate-buffered saline; SLS, sodium lauryl sulfate; SD, standard deviation.
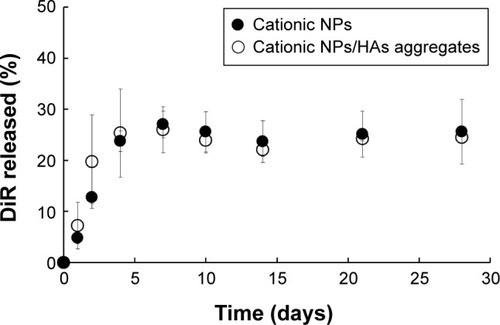
Figure 5 Representative in vivo fluorescence images of (A) DiR-loaded cationic NPs and (B) free DiR solution after IA injection in mice knee at various time points. Notes: The scale bar range is (A) 0.5–2×10⁸ and (B) 0.5–1.5×10⁸ in fluorescence intensity.
Abbreviations: DiR, 1,1′-dioctadecyl-3,3,3′,3′ tetramethylindotricarbocyanine iodide; NP, nanoparticle; IA, intra-articular.
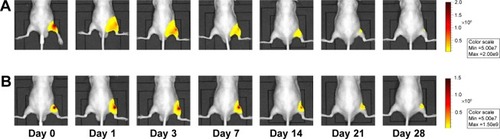
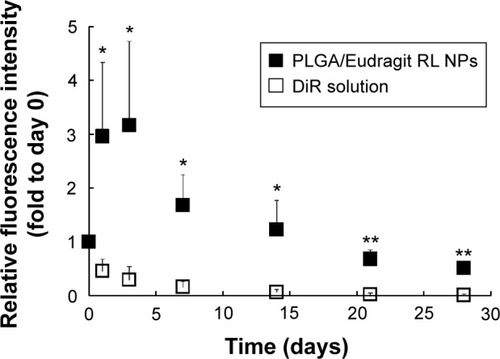
Figure 6 The relative fluorescence intensity profiles of DiR-loaded cationic NPs (■) or free DiR solution (□) after IA injection in mice knee.
Notes: The relative fluorescence intensities were expressed as fold-changes versus those determined immediately after IA injection (day 0) (n=3). The statistical analysis was performed using the Student’s t-test; *P<0.05 versus probe solution; **P<0.01 versus probe solution.
Abbreviations: DiR, 1,1′-dioctadecyl-3,3,3′,3′ tetramethylindotricarbocyanine iodide; NP, nanoparticle; IA, intra-articular; PLGA, poly(lactide-co-glycolide).