Figures & data
Figure 1 Absorption spectra of AuNPs after bioreduction by HAE of H. erinaceus.
Abbreviations: AuNPs, gold nanoparticles; h, hours; au, absorbance units; H. erinaceus, Hericium erinaceus; HAE, hot aqueous extract.
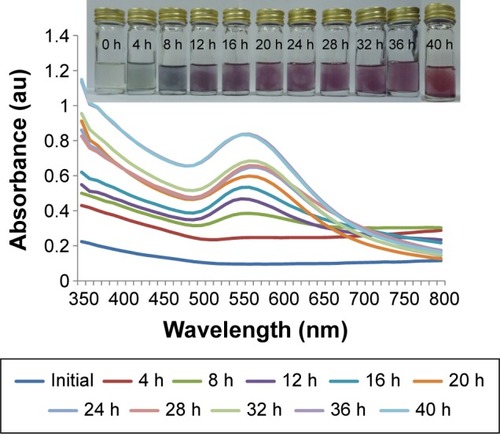
Figure 2 Electron microscopic micrographs of AuNPs mycosynthesized by HAE of H. erinaceus.
Notes: (A) TEM image of AuNPs solution formed by the reaction of gold (III) chloride with HAE of H. erinaceus for 36 hours. (B) Individual nanoparticles with clear lattice fringes through high-resolution TEM. (C) FESEM image of AuNPs.
Abbreviations: H. erinaceus, Hericium erinaceus; TEM, transmission electron microscopy; AuNPs, gold nanoparticles; FESEM, field emission scanning electron microscopy; HAE, hot aqueous extract.
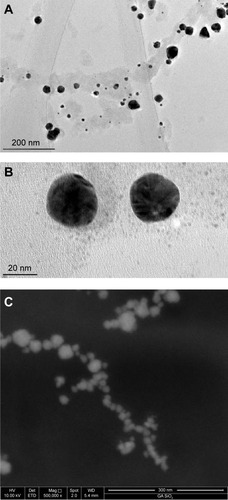
Figure 3 Size-distribution analysis by dynamic light scattering.
Note: The particle size-distribution analysis revealed that particle size was approximately 28 nm.
Abbreviation: d, diameter.
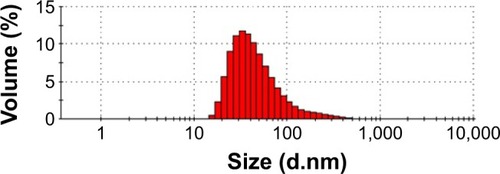
Figure 4 EDX image of AuNPs mycosynthesized by HAE of H. erinaceus.
Abbreviations: EDX, energy dispersive X-ray; AuNPs, gold nanoparticles; H. erinaceus, Hericium erinaceus; HAE, hot aqueous extract.
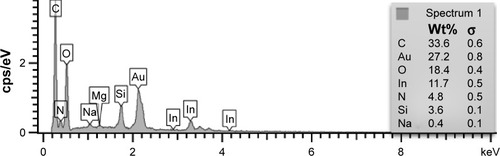
Figure 5 FTIR image of AuNPs mycosynthesized by HAE of H. erinaceus.
Notes: (A) Control: HAE of H. erinaceus, and (B) AuNPs mycosynthesized by HAE of H. erinaceus.
Abbreviations: FTIR, Fourier transform-infrared spectroscopy; AuNPs, gold nanoparticles; H. erinaceus, Hericium erinaceus; HAE, hot aqueous extract.
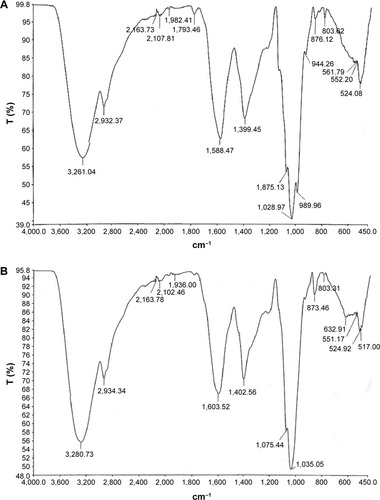
Figure 6 Determination of monosaccharide and protein composition in HAE of H. erinaceus by TLC and SDS-PAGE methods.
Notes: (A) TLC analysis of monosaccharide, (B) protein molecular markers, and (C) polypeptide profile of HAE on SDS-PAGE shows at least 14 different molecular mass proteins.
Abbreviations: TLC, thin layer chromatography; SDS-PAGE, sodium dodecyl sulfate–polyacrylamide gel electrophoresis; H. erinaceus, Hericium erinaceus; HAE, hot aqueous extract.
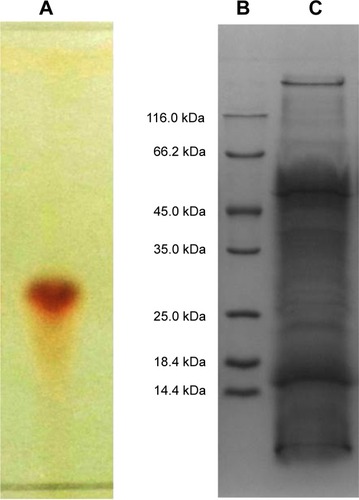
Figure 7 Effects of AuNPs mycosynthesized by HAE of H. erinaceus on the neurite outgrowth on PC-12 cells.
Notes: The percentage of neurite-bearing cells of PC-12 cells treated with various concentrations of AuNPs ranged from 200 to 2,000 ng/mL. Cells in complete F-12 K medium without AuNPs served as a negative control. Cells treated with 50 ng/mL of NGF or 50 μg/mL extract of aqueous extract of H. erinaceus served as positive controls. Data were expressed as means ± standard deviation of three experiments. *Significant difference (P<0.05).
Abbreviations: AuNPs, gold nanoparticles; NGF, nerve growth factor; NEG, negative control; H. erinaceus, Hericium erinaceus; HAE, hot aqueous extract.
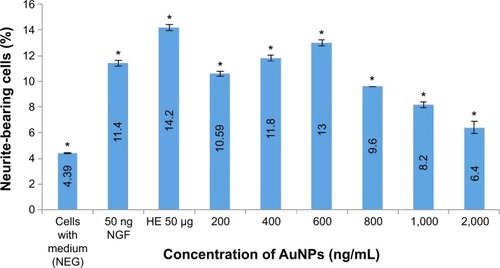
Figure 8 Phase-contrast micrographs of PC-12 neurites at day 3.
Notes: (A) Treatment with 50 ng/mL NGF. (B) Treatment with 50 μg/mL of HAE of H. erinaceus. (C) Negative control (complete F-12 K medium). (D–F) Various concentrations of AuNPs ranged from 200 to 600 ng/mL. Scale bar =20 μm. Arrows indicate neurite extensions.
Abbreviations: AuNPs, gold nanoparticles; NGF, nerve growth factor; H. erinaceus, Hericium erinaceus; HAE, hot aqueous extract.
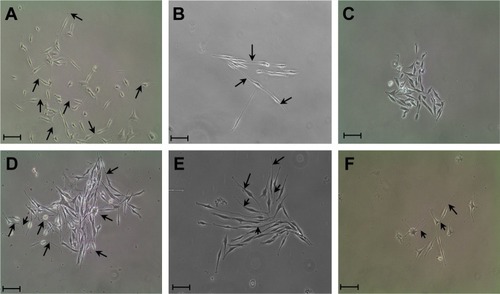
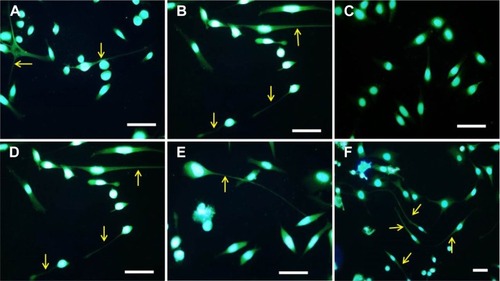
Figure 9 Morphology of PC-12 cells in different treatment groups observed under fluorescent microscopy.
Notes: (A) Treatment with 50 ng/mL NGF. (B) Treatment with 50 μg/mL of HAE of H. erinaceus. (C) Negative control, (complete F-12 K medium). (D–F) Various concentrations of AuNPs ranged from 200 to 600 ng/mL. Nuclei stained blue and neurofilaments stained green. Scale bar =40 μm. Arrows indicate neurite extensions.
Abbreviations: AuNPs, gold nanoparticles; NGF, nerve growth factor; H. erinaceus, Hericium erinaceus; HAE, hot aqueous extract.