Figures & data
Figure 1 The XRD scans of FePt NPs (A), the TEM image of FePt NPs (B), the size distribution of FePt NPs randomly acquired from 100 NPs (C), the hysteresis loop of FePt NPs recorded between –15,000 and 15,000 Oe at 300 K (D), and the FTIR spectrum of Bare FePt NPs, FePt-Cys NPs and Cys (E).
Abbreviations: XRD, X-ray diffraction; NPs, nanoparticles; TEM, transmission electron microscopy; AU, arbitrary unit.
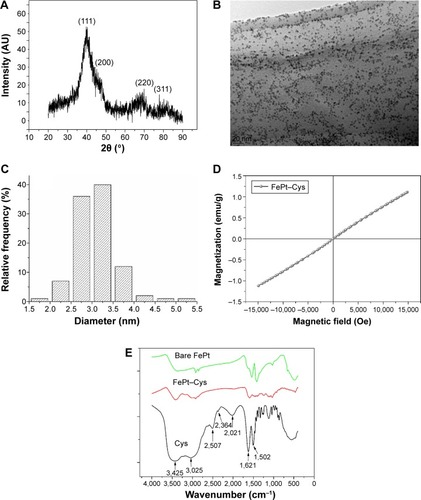
Figure 2 Cell viability of Vero cells treated with FePt NPs.
Note: Incubation time was 24 hours.
Abbreviation: NPs, nanoparticles.
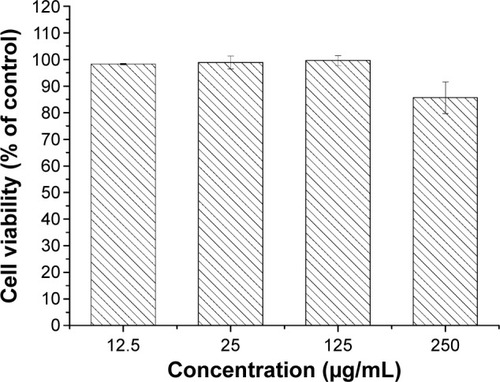
Figure 3 The growth inhibition of HeLa cells treated with FePt NPs combined with X-ray beams.
Note: Incubation time was 72 hours.
Abbreviation: NPs, nanoparticles.
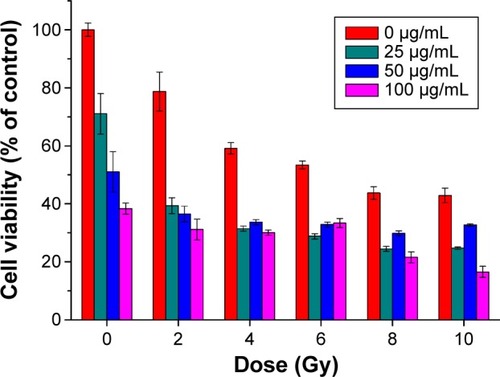
Figure 4 The growth inhibition of HeLa cells treated with FePt NPs before and after 2 Gy X-ray irradiation.
Notes: Incubation time was 72 hours; *P<0.05.
Abbreviation: NPs, nanoparticles.
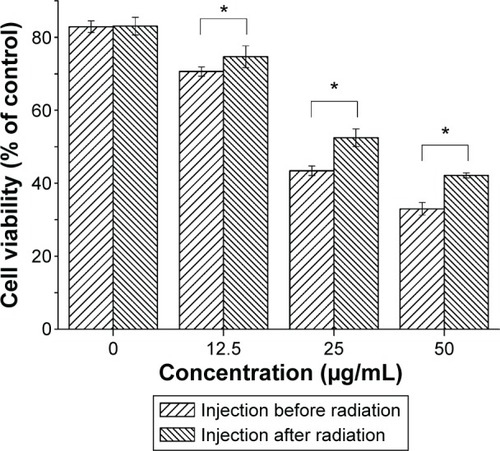
Figure 5 The TEM images of cellular uptake by FePt NPs.
Notes: The arrows in are used to point out FePt NPs entering the cell in A, and he FePt NPs entering the cell nucleus membrane in C and finally, the FePt NPs enwrapped by the vesicles in B and D. The scale of each TEM image is displayed in the lower right corner: 2 μm and 500 nm (A); 2 μm and 1 μm (B); 1 μm and 500 nm (C); and 1 μm (D).
Abbreviations: TEM, transmission electron microscopy; NPs, nanoparticles.
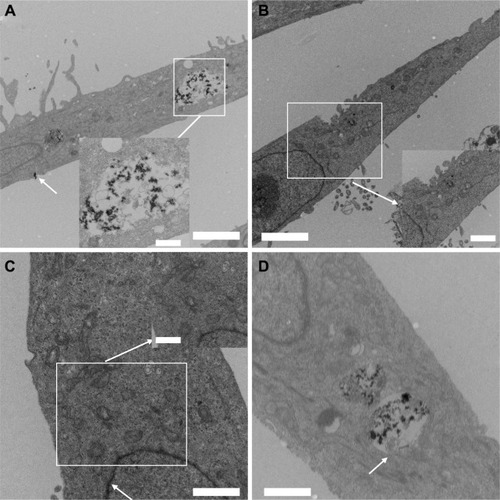
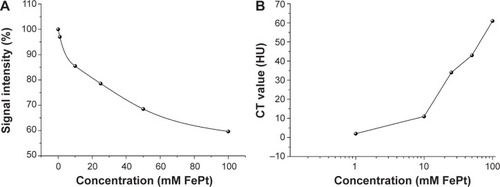
Figure 6 The calculated data curve of MRI/CT molecule imaging contrast enhancement with FePt NPs.
Notes: (A) MRI negative contrast enhancement; (B) CT positive contrast enhancement.
Abbreviations: NPs, nanoparticles; MRI, magnetic resonance imaging; CT, computed tomography.