Figures & data
Figure 1 Antitumor activity in melanoma-bearing mice.
Notes: Mice treated with PTX oleate 17.5 μmol/kg associated with LDE + Simva 50 mg/kg; PTX oleate 17.5 μmol/kg associated with LDE; commercial formulation of PTX 17.5 μmol/kg + Simva 50 mg/kg; commercial formulation of PTX 17.5 μmol/kg; Simva 50 mg/kg; and saline solution 0.9% as control. Animals were intraperitoneally injected with chemotherapy on days 11, 14, and 19. Simva was administered daily by gavage from day 11 to day 19. Each group comprised ten to 16 animals. Tumor sizes were monitored by periodic caliper measurements, and are presented as means ± standard error of mean. (A) Tumor-growth curves: Θvs Simva (P<0.05); χχχvs LDE-PTX and Simva, vs LDE-PTX, and vs PTX (P<0.001); #vs PTX and Simva (P<0.05); αvs LDE-PTX (P<0.05); ***vs LDE-PTX and Simva (P<0.001); εεvs PTX (P<0.01); ΨΨΨvs LDE-PTX and Simva and vs LDE-PTX (P<0.001); +++vs all the other groups (P<0.001). (B) Kaplan–Meier survival curves. (C) Percentage of animals bearing macroscopic metastasis: ••vs saline (P<0.01); •vs saline (P<0.05); #vs PTX and Simva (P<0.05).
Abbreviations: PTX, paclitaxel; LDE, lipid nanoemulsion; Simva, simvastatin.
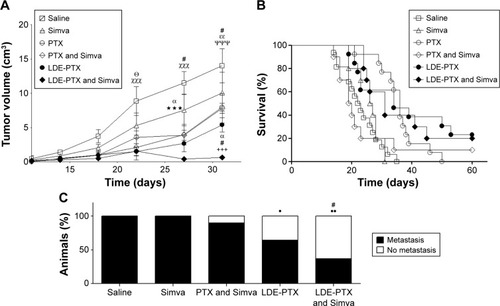
Figure 2 Histological study of tumors from melanoma-bearing mice.
Notes: Mice treated with PTX oleate 17.5 μmol/kg associated with LDE + Simva 50 mg/kg; PTX oleate 17.5 μmol/kg associated with LDE; commercial formulation of PTX 17.5 μmol/kg + Simva 50 mg/kg; Simva 50 mg/kg; and saline solution 0.9% as control. Animals were intraperitoneally injected with chemotherapy on days 11, 14, and 19. Simva was administered daily by gavage from day 11 to day 19. Each group comprised six animals. Representative photomicrographs from tumors stained with hematoxylin–eosin (A–E) and picrosirius red (F–J) in which the collagen stained red, magnification 200×. Photomicrographs from tumor-tissue sections were analyzed regarding tumor-cell density (K) and presence of collagen types I and III (L) with NIS-Elements 3.2 Advanced Research image-analysis software (Nikon Corporation, Tokyo, Japan), and results are presented as means ± standard error of mean: ΘΘΘvs Simva (P<0.001); ΘΘvs Simva (P<0.01); ###vs PTX and Simva (P<0.001); #vs PTX and Simva (P<0.05); αvs LDE-PTX (P<0.05); ^^^vs all the other groups (P<0.001); ^^vs all the other groups (P<0.01); •••vs saline (P<0.001).
Abbreviations: PTX, paclitaxel; LDE, lipid nanoemulsion; Simva, simvastatin.
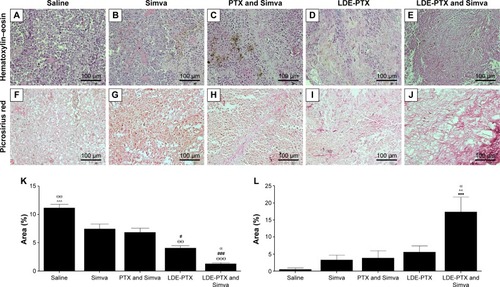
Figure 3 Immunohistochemical study of tumors from melanoma-bearing mice.
Notes: Mice treated with PTX oleate 17.5 μmol/kg associated with LDE + Simva 50 mg/kg; PTX oleate 17.5 μmol/kg associated with LDE; commercial formulation of PTX 17.5 μmol/kg + Simva 50 mg/kg; Simva 50 mg/kg; and saline solution 0.9% as control. Animals were intraperitoneally injected with chemotherapy on days 11, 14, and 19. Simva was administered daily by gavage from day 11 to day 19. Each group comprised six animals. Representative photomicrographs from tumors (magnification 200×) after 3,3′-diaminobenzidine chromogen immunostaining for ICAM/CD54 (A–E), MMP-9 (F–J), MCP-1 (K–O), and LDLr (P–T). A quantitative image analysis of the immunostaining for ICAM/CD54 (U), MMP-9 (V), MCP-1 (W), and LDLr (X) was performed, and results are presented as means ± standard error of mean: •••vs saline (P<0.001); •vs saline (P<0.05); Θvs Simva (P<0.05); αvs LDE-PTX (P<0.05); +++vs all groups (P<0.001); ###vs PTX and Simva (P<0.001).
Abbreviations: ICAM-1, intercellular adhesion molecule-1; LDE, lipid nanoemulsion; LDLr, low-density lipoprotein receptor; MCP-1, monocyte chemoattractant protein-1; MMP-9, matrix metalloproteinase-9; PTX, paclitaxel; Simva, simvastatin.
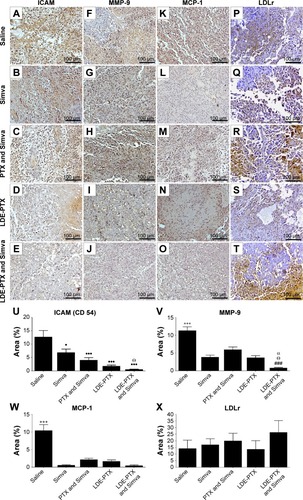
Figure 4 Mitochondrial membrane potential.
Notes: Accessed by flow-cytometry analysis performed in tumor samples collected 48 hours after treatment of melanoma-bearing mice with PTX oleate 17.5 μmol/kg associated with LDE + Simva 50 mg/kg; PTX oleate 17.5 μmol/kg associated with LDE; commercial formulation of PTX 17.5 μmol/kg and Simva 50 mg/kg; Simva 50 mg/kg; and saline solution 0.9% as control. Animals were intraperitoneally injected with chemotherapy on days 11, 14, and 19. Simva was administered daily by gavage from day 11 to day 19. (A) Representative histograms of rhodamine 123 fluorescence intensity. (B) Percentage of cell viability estimated by retention of rhodamine 123 in living cells. Each group comprised three animals. Results are presented as means ± standard error of mean: +++vs all groups (P<0.001).
Abbreviations: PTX, paclitaxel; LDE, lipid nanoemulsion; Simva, simvastatin.
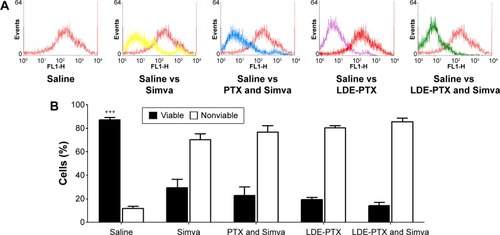
Figure 5 Cyclin D1, p21, and p27 proteins.
Notes: Accessed by flow-cytometry analysis of tumor samples collected 48 hours after treatment of melanoma-bearing mice with PTX oleate 17.5 μmol/kg associated with LDE + Simva 50 mg/kg; PTX oleate 17.5 μmol/kg associated with LDE; commercial formulation of PTX 17.5 μmol/kg and Simva 50 mg/kg; Simva 50 mg/kg; and saline solution 0.9% as control. Animals were intraperitoneally injected with chemotherapy on days 11, 14, and 19. Simva was administered daily by gavage from day 11 to day 19. Each group comprised three animals. Results are presented as means ± standard error of mean. (A, C, E) Percentage of cells expressing cyclin D1, p21, and p27: ••vs saline (P<0.01); •vs saline (P<0.05); αvs LDE-PTX (P<0.05); ΘΘvs Simva (P<0.01); ***vs LDE-PTX and Simva (P<0.001); ##vs PTX and Simva (P<0.01); #vs PTX and Simva (P<0.05). (B, D, F) Representative dot plots of protein cyclin D1, p21, and p27 expression.
Abbreviations: PTX, paclitaxel; LDE, lipid nanoemulsion; Simva, simvastatin.
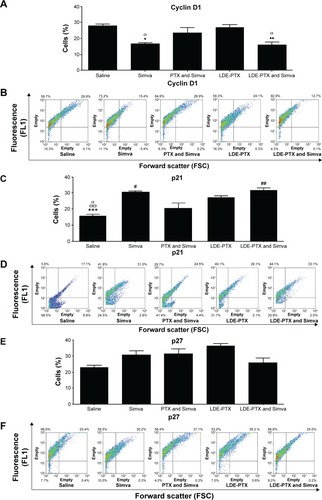
Figure 6 Hematological profile of melanoma-bearing mice.
Notes: Mice under treatment with PTX oleate 17.5 μmol/kg associated with LDE + Simva 50 mg/kg; PTX oleate 17.5 μmol/kg associated with LDE; commercial formulation of PTX 17.5 μmol/kg and Simva 50 mg/kg; Simva 50 mg/kg; and saline solution 0.9% as control. Animals were intraperitoneally injected with chemotherapy on days 11, 14, and 19. Simva was administered daily by gavage from day 11 to day 19. The basal group was composed of untreated mice before tumor-cell inoculation. Each group comprised five animals. Values are presented as means ± standard error of mean. (A) White blood cell (WBC) count: ###vs PTX and Simva (P<0.001); ##vs PTX and Simva (P<0.01); #vs PTX and Simva (P<0.05); ••vs saline (P<0.01); •vs saline (P<0.05); Θvs Simva (P<0.05). (B) Platelet count: #vs PTX and Simva (P<0.05); Θvs Simva (P<0.05); **vs LDE-PTX and Simva (P<0.01); ••vs saline (P<0.01). (C) Red blood cell (RBC) count: □□vs basal (P<0.01); □vs basal (P<0.05). (D) Hemoglobin concentration: □□□vs basal (P<0.001); □□vs basal (P<0.01); □vs basal (P<0.05). (E) Hematocrit.
Abbreviations: PTX, paclitaxel; LDE, lipid nanoemulsion; Simva, simvastatin.
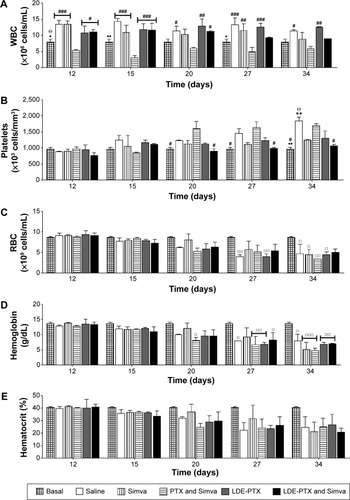
Figure 7 Drug toxicity in BALB/c mice without tumors.
Notes: Mice under treatment with PTX oleate 17.5 μmol/kg associated with LDE + Simva 50 mg/kg; PTX oleate 17.5 μmol/kg associated with LDE; commercial formulation of PTX 17.5 μmol/kg and Simva 50 mg/kg; Simva 50 mg/kg; and saline solution 0.9% as control. Animals were intraperitoneally injected with chemotherapy on days 1, 4, and 9. Simva was administered daily by gavage from day 1 to day 9. (A) Kaplan–Meier survival curves: △PTX and Simva; ▣the other treatment groups, namely LDE-PTX and Simva, LDE-PTX, Simva, and saline (n=11). (B) Body-weight variation. Results are presented as means ± standard error of mean (n=11): •••vs saline (P<0.001); ^^vs LDE-PTX and Simva, LDE-PTX, and Simva (P<0.01); +++vs all groups (P<0.001).
Abbreviations: PTX, paclitaxel; LDE, lipid nanoemulsion; Simva, simvastatin.
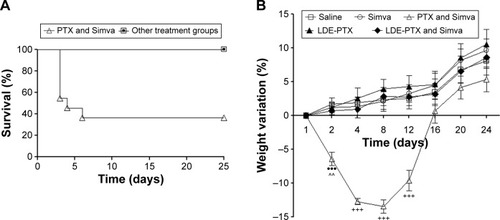
Figure 8 Hematological profile of BALB/c mice.
Notes: Mice without tumors under treatment with PTX oleate 17.5 μmol/kg associated with LDE + Simva 50 mg/kg; PTX oleate 17.5 μmol/kg associated with LDE; commercial formulation of PTX 17.5 μmol/kg and Simva 50 mg/kg; Simva 50 mg/kg; and saline solution 0.9% as control. Animals were intraperitoneally injected with chemotherapy on days 1, 4, and 9. Simva was administered daily by gavage from day 1 to day 9. Each group comprised five animals. Values are presented as means ± standard error of mean. (A) White blood cell (WBC) count: ###vs PTX and Simva (P<0.001); ##vs PTX and Simva (P<0.01); #vs PTX and Simva (P<0.05). (B) Platelet count: ###vs PTX and Simva (P<0.001); ##vs PTX and Simva (P<0.01); #vs PTX and Simva (P<0.05). (C) Red blood cell (RBC) count. (D) Hemoglobin concentration. (E) Hematocrit.
Abbreviations: PTX, paclitaxel; LDE, lipid nanoemulsion; Simva, simvastatin.
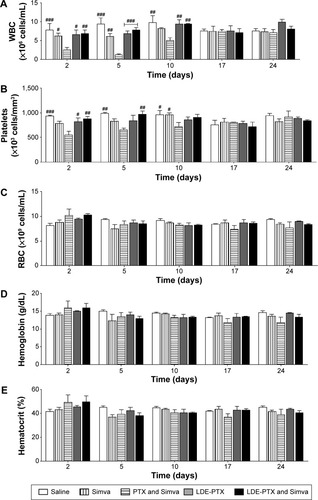
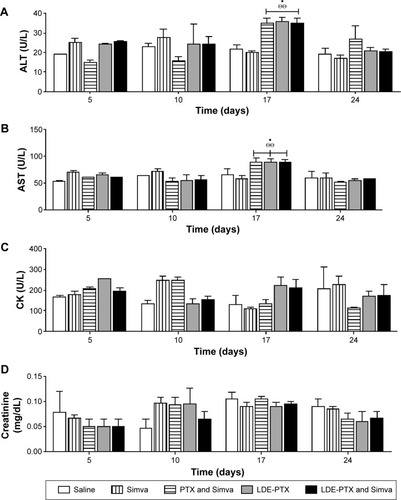
Figure 9 Clinical chemistry parameters of BALB/c mice.
Notes: Mice without tumors treated with PTX oleate 17.5 μmol/kg associated with LDE + Simva 50 mg/kg; PTX oleate 17.5 μmol/kg associated with LDE; commercial formulation of PTX 17.5 μmol/kg and Simva 50 mg/kg; Simva 50 mg/kg; and saline solution 0.9% as control. Animals were intraperitoneally injected with chemotherapy on days 1, 4, and 9. Simva was administered daily by gavage from day 1 to day 9. Each group comprised five animals. Values are presented as means ± standard error of mean. (A) ALT plasma activity: •vs saline (P<0.05); ΘΘvs Simva (P<0.01). (B) AST plasma activity: •vs saline (P<0.05); ΘΘvs Simva (P<0.01). (C) CK plasma activity. (D) Creatinine plasmatic concentration.
Abbreviations: PTX, paclitaxel; LDE, lipid nanoemulsion; Simva, simvastatin; ALT, alanine transaminase; AST, aspartate transaminase; CK, creatine kinase.