Figures & data
Figure 1 TEM micrograph of magnetic liposomes. The average size of the liposomes is ∼150 nm.
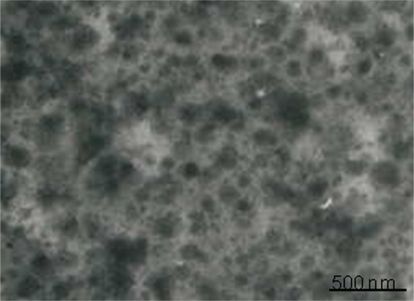
Figure 2 Magnetic AZTTP liposomes inhibit HIV-1 p24 production. PBMCs (1 × 10⁶ cells/mL) obtained from normal subjects were infected with native HIV-1 IIIB (NIH AIDS Research and Reference Reagent Program Cat# 398) at a concentration of 103.0 TCID50/mL cells for 3 hours and washed 3 times with Hank’s balanced salt solution (GIBCO-BRL, Grand Island, NY) before being returned to culture with and without free AZTTP or magnetic AZTTP liposomes (1–100 nM) for 7 and 14 days. The culture supernatants were quantitated for HIV-1 p24 antigen using a p24 ELISA kit (ZeptoMetrix Corporation, Buffalo, NY). The data represent the average of 3 independent experiments and are expressed as ng/mL. Statistical analysis was done using one way ANOVA with Bonferroni adjustment.
#Comparison between MP-AZTTP liposome and free AZTTP group.
Abbreviations: AZTTP, azidothymidine 5’-triphosphate; MP-AZTTP, magnetic nanoparticles bound AZTTP.
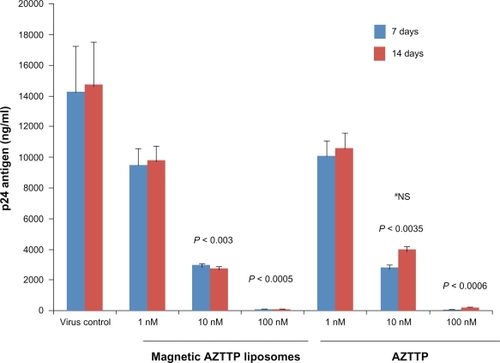
Table 1 Cytotoxicity of AZTTP and MP-AZTTP liposomes
Figure 3 Transmigration of MP-AZTTP liposomes across the blood–brain barrier (BBB) model. Apparent permeability coefficients (Papp) of MP-AZTTP transport across the BBB model as free and in magnetic liposomes. The data represents the mean ± SE of 3 independent experiments and is expressed as cm/min. Statistical analysis was performed using unpaired Student’s t-test.
Abbreviations: AZTTP, azidothymidine 5’-triphosphate; MP-AZTTP, magnetic nanoparticles bound AZTTP.
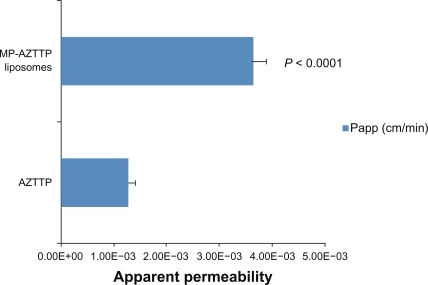
Table 2 Transendothelial electrical resistance (TEER) values of the in vitro blood–brain barrier model before and after treatment with magnetic nanoformulation
Figure 4 Uptake of magnetic liposomes by human monocytes. Monocytes were co-cultured with rDHPE-magnetic liposomes for 2 and 4 hours and their intracellular localization was assessed by fluorescence microscopy (Zeiss, Germany). Engulfed magnetic liposomes can be visualized as red fluorescence located within the cell cytoplasm.
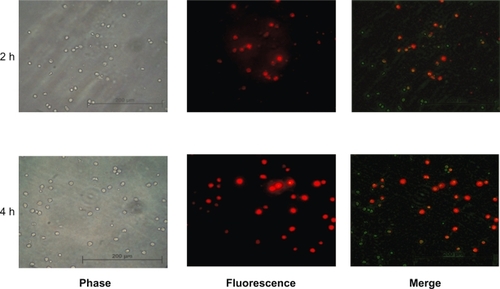
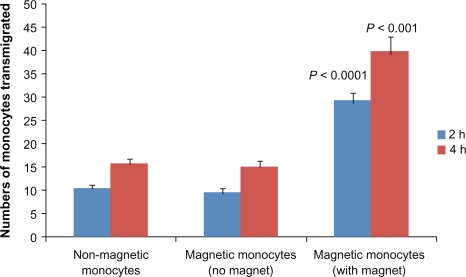
Figure 5 Transmigration of monocytes across the in vitro blood–brain barrier (BBB). Magnetic liposome loaded monocytes were added in the upper chamber of the BBB model with or without a magnet placed underneath for the duration of experiment. At 2 and 4 hours after plating, migrated monocytes were counted in the lower chamber. Results are expressed as mean ± SE of three independent experiments. Statistical significance was determined using unpaired Student’s t-test.