
Figures & data
Table 1 Characterization of ROP and the conjugates by HPGPC
Table 2 Pharmacokinetic parameters of FR, FP20k-R, FP40k-R, and FR loaded in L-Lp after intravenous injection at a same molar dose of 4 μmol/kg in rats (n=3)
Figure 1 Blood clearance of FR (■), FP20k-R (□), FP40k-R (○), and FR loaded in L-Lp (Δ) after intravenous injection at a same molar dose of 4 μmol/kg in rats (n=3).
Abbreviations: FR, FITC-labeled ROP; FP20k-R, FITC-labeled 20-kDa PEG mono-modified ROP; FP40k-R, FITC-labeled 40-kDa PEG mono-modified ROP; L-Lp, long-circulating liposomes; h, hour; FITC, fluorescein isothiocyanate; PEG, polyethylene glycol; ROP, Radix Ophiopogonis polysaccharide.
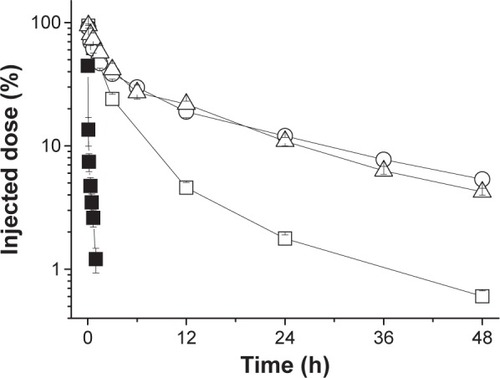
Table 3 The ratio of fluorescent intensity for each myocardial area in drug-treated or -untreated IR rats to that for myocardium in normal rats without drug treatment (n=3)
Figure 2 Fluorescent images of left ventricular transverse slices of rats.
Notes: Representative fluorescent images of left ventricular transverse slices taken from normal rats (A), normal rats that received FP20k-R and were sacrificed at 12 hours postdose (B), IR rats (C), and IR rats that received FP20k-R and were sacrificed at 12 hours postdose (D).
Abbreviations: FP20k-R, FITC-labeled 20-kDa PEG mono-modified ROP; IR, ischemia/reperfusion; FITC, fluorescein isothiocyanate; PEG, polyethylene glycol; ROP, Radix Ophiopogonis polysaccharide.
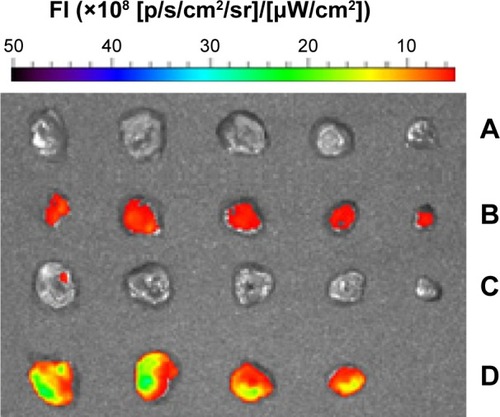
Figure 3 Fluorescent images and TTC staining photos of left ventricular transverse slices of rats.
Notes: Representative fluorescent images (up) and the corresponding TTC staining photos (down) of left ventricular transverse slices taken from IR rats that received FP40k-R (left) or L-Lp loaded with FR (right) and were sacrificed at 12 hours postdose.
Abbreviations: TTC, triphenyltetrazolium chloride; IR, ischemia/reperfusion; FP40k-R, FITC-labeled 40-kDa PEG mono-modified ROP; L-Lp, long-circulating liposomes; FR, FITC-labeled ROP; FITC, fluorescein isothiocyanate; PEG, polyethylene glycol; ROP, Radix Ophiopogonis polysaccharide.
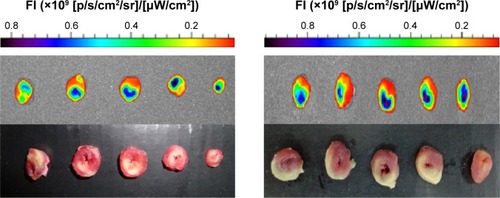
Figure 4 Changes in the fluorescent intensity of drugs with time postdose in infarcted myocardium (Is) and noninfarcted myocardium (N-Is) of IR rats.
Notes: For direct comparison among groups, the fluorescent intensities of FP20k-R and FP40k-R were converted to ones equivalent to FR via the molar fluorescent ratios of FP20k-R and FP40k-R to FR, which are 1.15 and 0.737, respectively. **P<0.01, *P<0.05, compared with Is at the same time point; ##P<0.01, #P<0.05, compared with L-Lp in Is at the same time point; &&P<0.01, compared with FP20k-R in Is at the same time point; $$P<0.01, compared with FP20k-R in Is at 3 hours.
Abbreviations: IR, ischemia/reperfusion; FP20k-R, FITC-labeled 20-kDa PEG mono-modified ROP; FP40k-R, FITC-labeled 40-kDa PEG mono-modified ROP; FR, FITC-labeled ROP; L-Lp, long-circulating liposomes; min, minutes; h, hour; FITC, fluorescein isothiocyanate; PEG, polyethylene glycol; ROP, Radix Ophiopogonis polysaccharide.
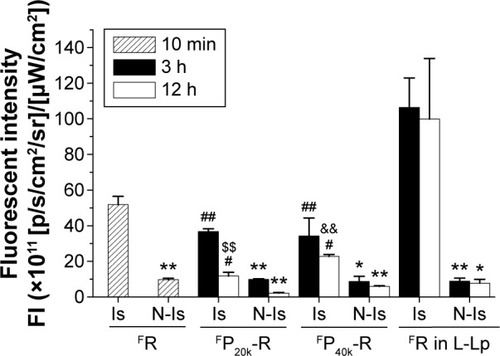
Figure 5 The EPR effect-based infarcted myocardium targeting efficacy of FR, FP20k-R, FP40k-R, and L-Lp loaded with FR at different times postdose.
Notes: The targeting efficacy was calculated as the ratio of drug fluorescence intensity in the infarcted myocardium to that in the noninfarcted myocardium. ##P<0.01, #P<0.05, compared with L-Lp at the same time point.
Abbreviations: EPR, enhanced permeability and retention; FR, FITC-labeled ROP; FP20k-R, FITC-labeled 20-kDa PEG mono-modified ROP; FP40k-R, FITC-labeled 40-kDa PEG mono-modified ROP; L-Lp, long-circulating liposomes; min, minutes; h, hour; FITC, fluorescein isothiocyanate; PEG, polyethylene glycol; ROP, Radix Ophiopogonis polysaccharide.
